 Adding more points to a scale can increase its reliability and sensitivity.
But more points also take up additional screen real-estate space. Imagine twenty or a hundred points displayed on desktop or, even worse, on mobile.
One recent digital alternative, allowing for nuanced ratings using the same screen real-estate as a traditional scale, is the slider.
Sliders allow respondents to make nuanced ratings (e.g., 4.4 on a five-point scale instead of a rating of 4 or 5) that can provide up to hundreds of points of discrimination.
In previous literature reviews and our UX research, however, comparisons of ratings collected with sliders and numeric scales have been mixed [PDF].
We typically find no substantial (nor statistical) differences in mean scores between UX-Lite™ scores collected with two five-point rating scales (interpolated to 0–100 points then averaged) and scores collected with two 0–100-point sliders (averaged). We have, however, previously found a moderate sensitivity advantage for sliders relative to five-point numeric scales, possibly due to slightly smaller standard deviations for slider ratings.
In practical research, this advantage needs to be balanced against findings that manipulating a slider can be more physically and cognitively demanding than just clicking a radio button, affecting completion times and user preference.
Earlier this year, we conducted an experiment in which 212 respondents (U.S. panel agency, late January 2021) used radio buttons and sliders to rate online shopping websites (Amazon, Walmart, Target, Walgreens, CVS, Wayfair) and seller marketplaces (Craigslist, eBay, Etsy, Facebook Marketplace) with the UX-Lite questionnaire (two five-point items) and a single eleven-point Likelihood-to-Recommend (LTR) item.
About half (109) of the respondents completed the survey on a desktop computer and the other half (103) used a mobile device. All respondents made ratings with numeric scales and sliders, with the order of presentation and assignment of scale type to website type randomized in accordance with a Greco-Latin experimental design.
We’ve previously published results from this experiment on the comparison of horizontal and vertical orientation of numeric ratings scales and sliders versus five-point numeric scales on desktop and mobile devices. We found no evidence of strong, consistent effects on rating behavior due to these manipulations.
In this article, we investigate differences in numeric and slider versions of the eleven-point LTR item collected on both desktop and mobile devices.
Numeric and Slider Scale Designs for Likelihood-to-Recommend
Figures 1–4 show the variations of the LTR item used in the experiment.
In this experiment, the slider sensitivity was 0.1, with the selected value appearing in a tooltip as shown in Figures 2 and 4. The slider’s initial position was in the center of the scale, but it had no value until the user manipulated it.
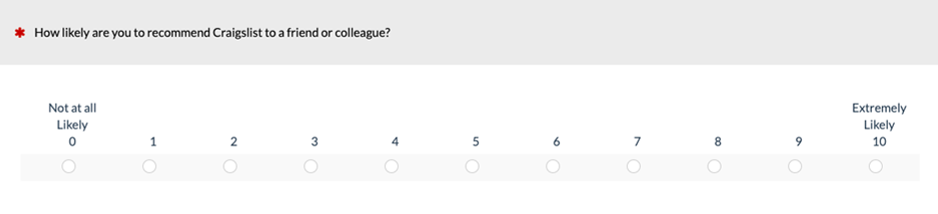
Figure 1: Example of numeric version of the LTR item on a desktop web browser (created with MUIQ®).

Figure 2: Example of slider version of the LTR item on a desktop web browser (created with MUIQ).
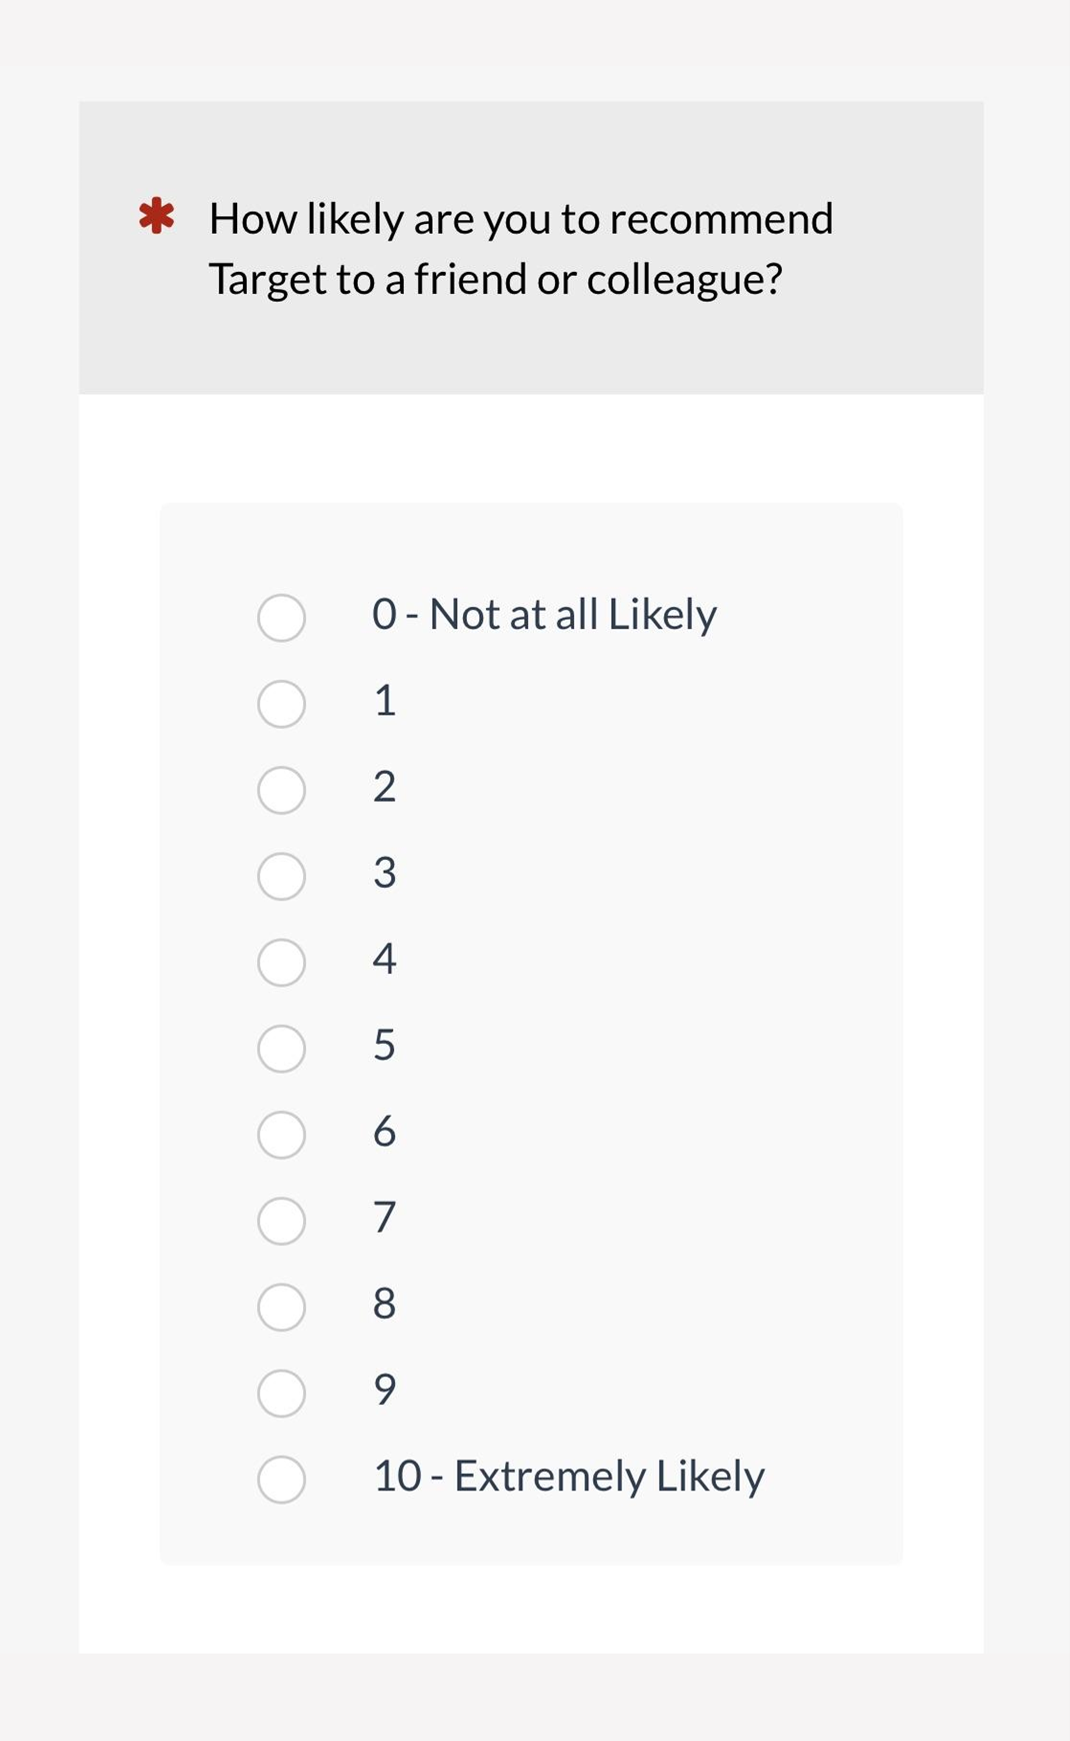
Figure 3: Example of numeric version of the LTR item on a mobile screen (created with MUIQ).

Figure 4: Example of slider version of the LTR item on a mobile screen (created with MUIQ).
Results
Means
Figure 5 shows the Likelihood-to-Recommend (LTR) means (with 95% confidence intervals) as a function of device (desktop, mobile) and item format (radio button numeric, slider).
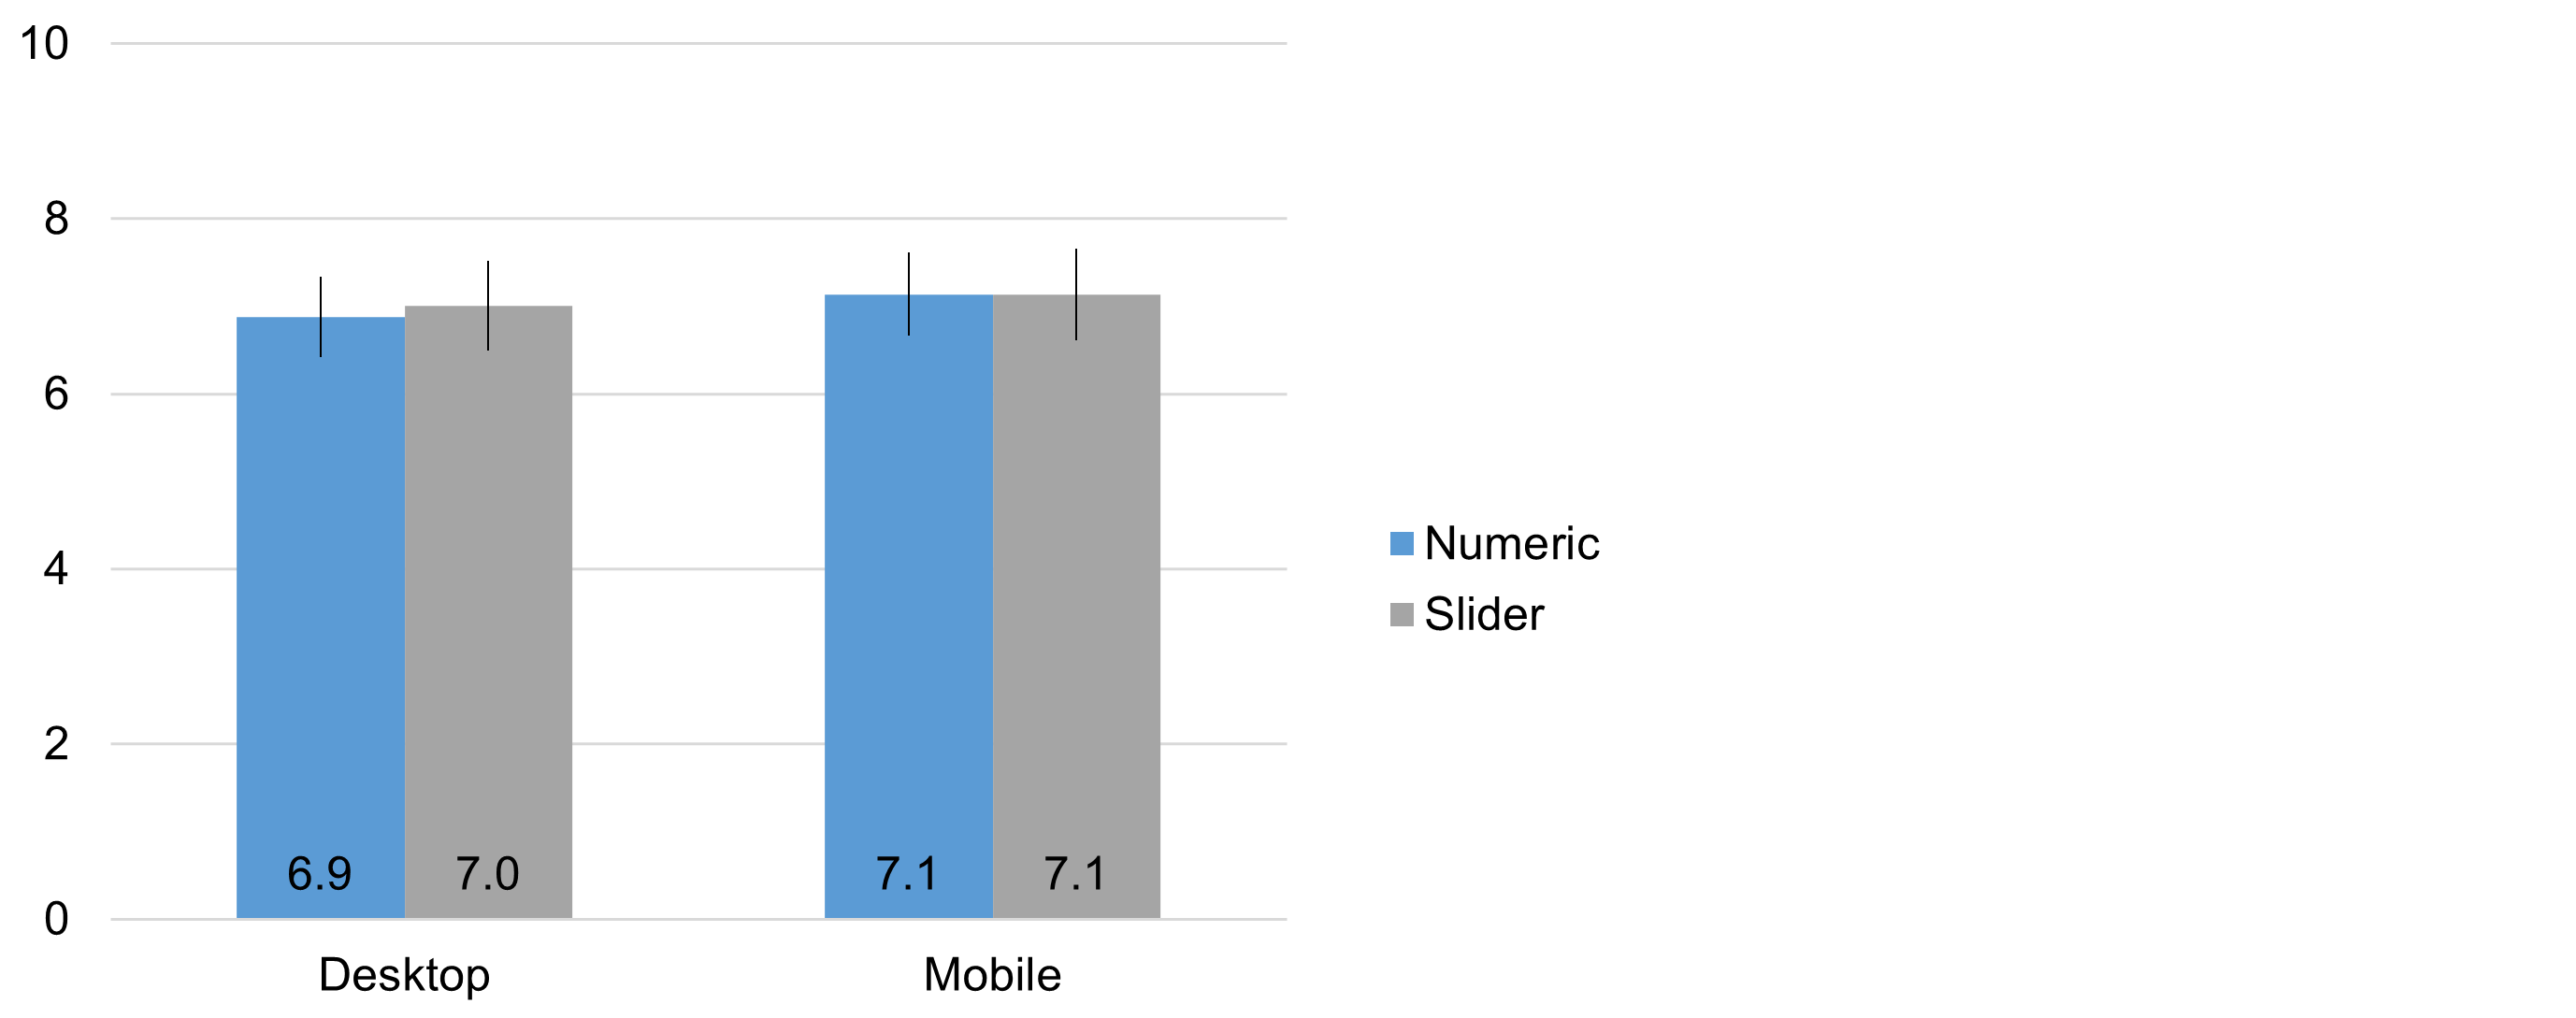
Figure 5: LTR means (and 95% confidence intervals) for radio button numeric and slider scale ratings on desktop and mobile devices.
The means were almost identical across all conditions. More specifically, an analysis of variance indicated no significant interaction between the independent variables of device and scale format (F(1, 210) = 0.11, p = .75). The main effect of scale format was also nonsignificant (Radio mean: 7.00, Slider mean: 7.06, observed difference of 0.06 with 95% confidence interval from −0.36 to 0.49, t(211) = 0.30, p = .77), as was the main effect of device (Desktop mean: 6.94, Mobile mean: 7.13, observed difference of 0.19 with 95% confidence interval from −0.35 to 0.74, t(210) = 0.70, p = .48).
LTR Response Distributions
Figure 6 shows the LTR item response distributions for numeric and slider formats (a within-subjects comparison because each respondent had the opportunity to provide UX-Lite ratings with each format). The following assignments were used to place slider responses into discrete bins matching the 0–100-point ratings with radio buttons.
- 0: Slider responses less than 0.6
- 1: Slider responses from 0.6 to 1.5
- 2: Slider responses from 1.6 to 2.5
- 3: Slider responses from 2.6 to 3.5
- 4: Slider responses from 3.6 to 4.5
- 5: Slider responses from 4.6 to 5.5
- 6: Slider responses from 5.6 to 6.5
- 7: Slider responses from 6.6 to 7.5
- 8: Slider responses from 7.6 to 8.5
- 9: Slider responses from 8.6 to 9.5
- 10: Slider responses greater than 9.5
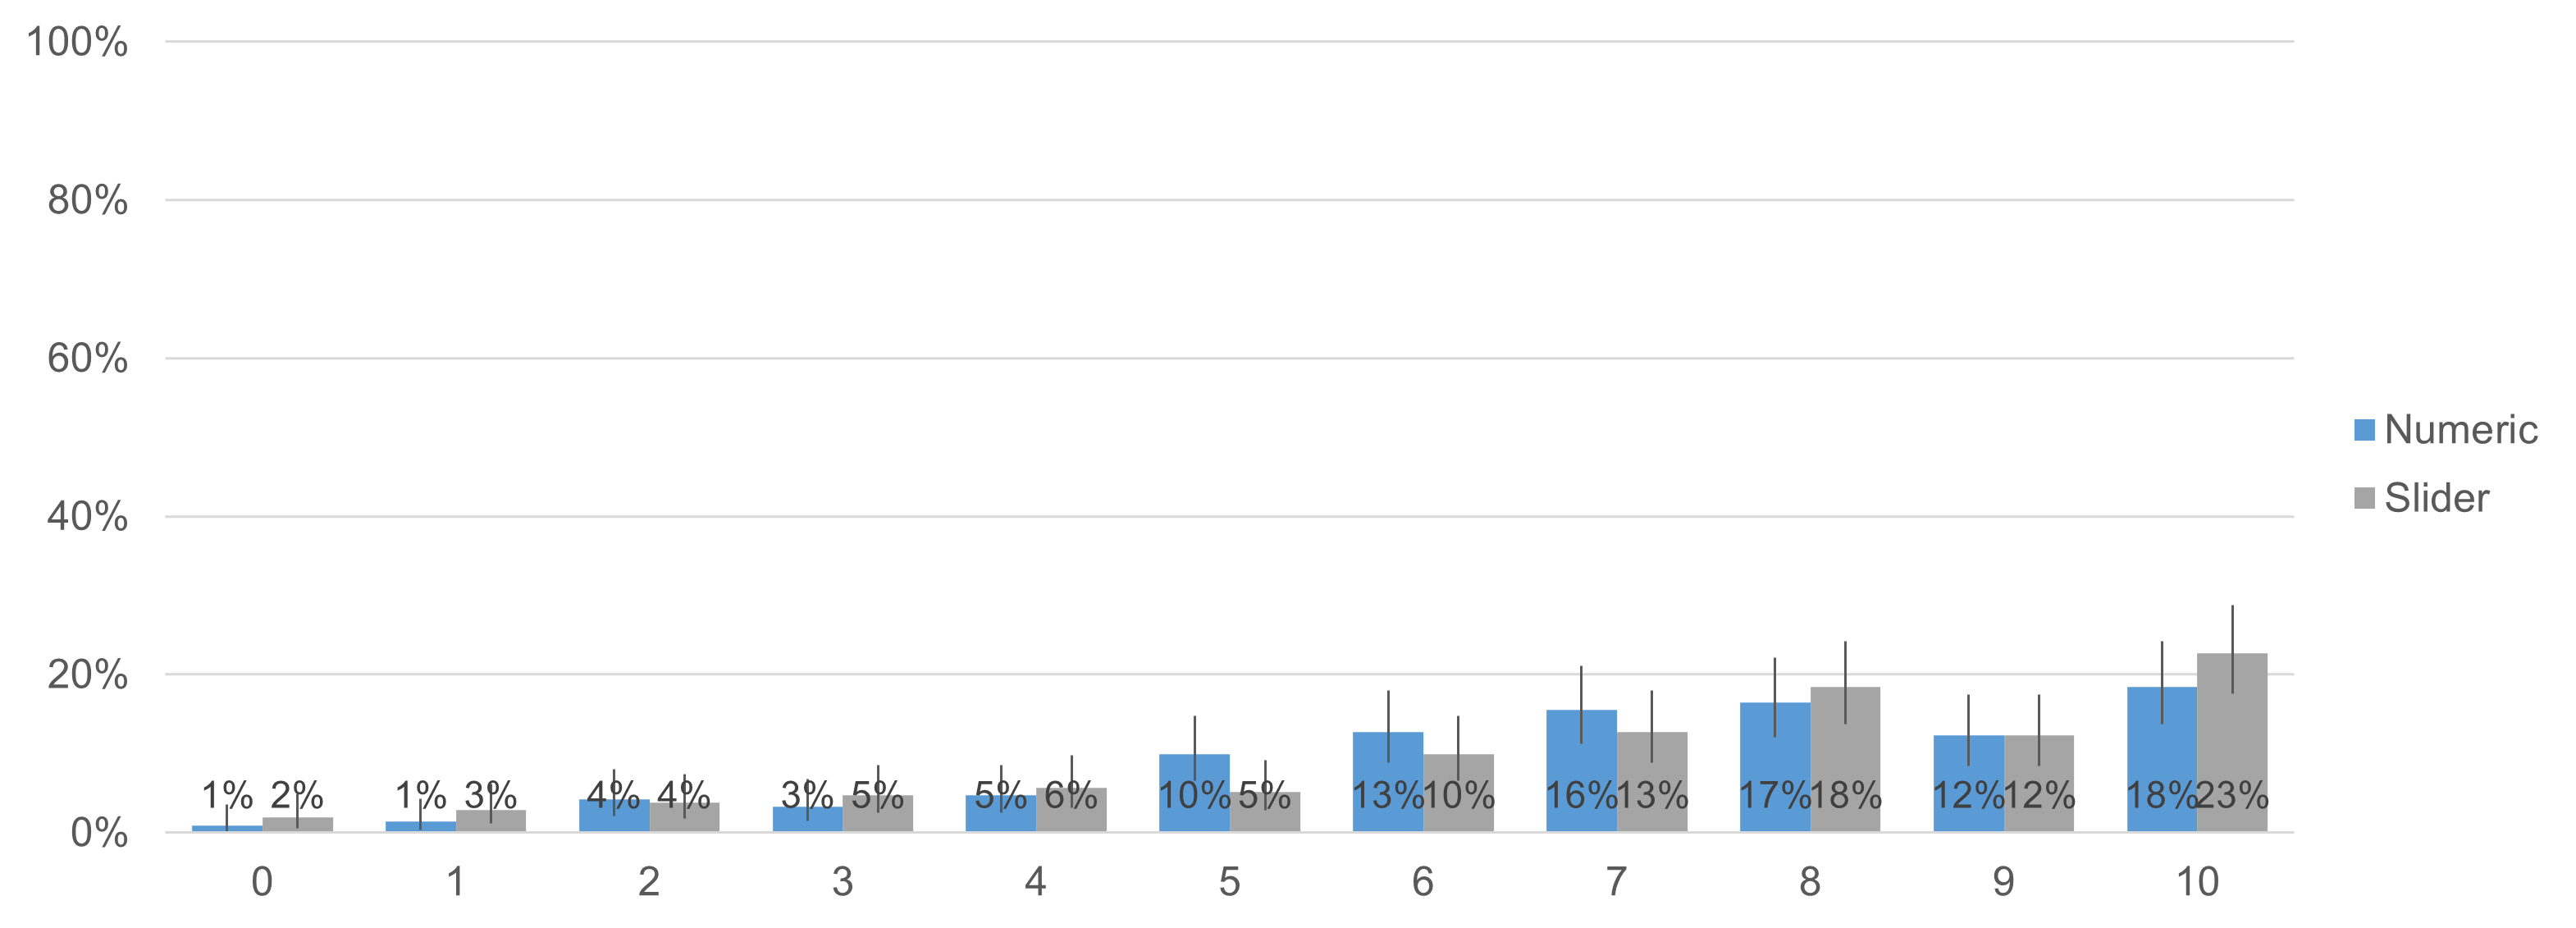
Figure 6: Distributions for the LTR item for numeric and slider formats.
The response distributions in Figure 6 are not identical, but neither are they dramatically different.
Figure 7 shows the distributions for the Net Promoter Score (NPS) categories derived from LTR (Detractors are those who rated LTR from 0–6, Passives rated 7–8, and Promoters rated 9–10). There were some differences in the distributions, with the slider group having slightly more promoters and slightly fewer detractors. However, McNemar mid-probability tests of the numeric and slider scale differences were not statistically significant (Detractors: p = .46, Passives: p = .82, Promoters: p = .25).
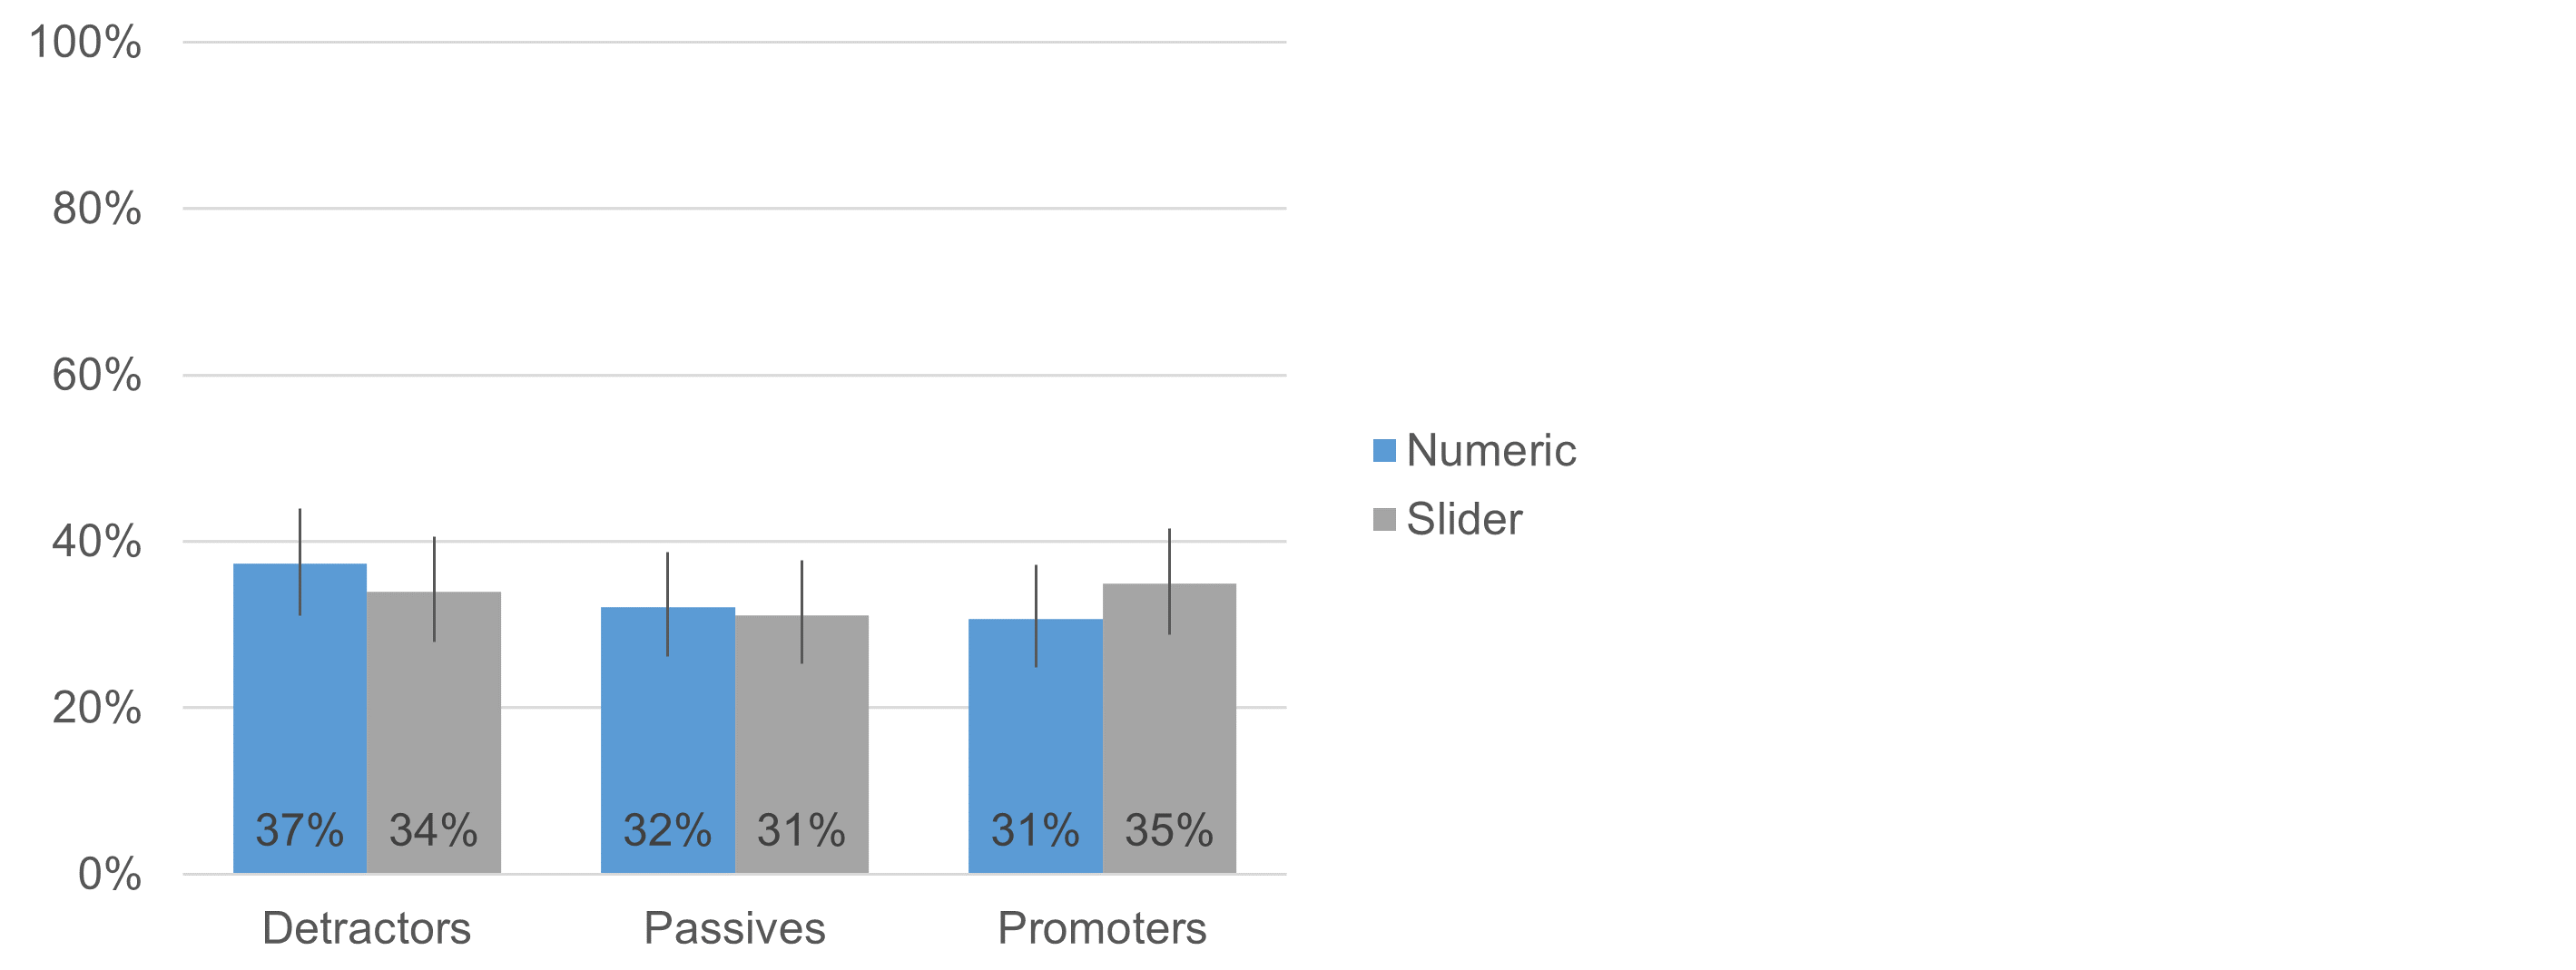
Figure 7: NPS category distributions for numeric and slider formats.
Summary and Takeaways
We experimented (n = 212) to see how two independent variables—scale format (radio button numeric scales vs. slider scales) and device (desktop vs. mobile)—affected rating behaviors. In this article, we focused on analyses of an eleven-point LTR item, obtaining results that were similar to those we recently reported for the five-point scales of the UX-Lite.
The main takeaway is that there does not appear to be large differences in rating behaviors for radio button numeric scales versus sliders for both five- and eleven-point scales, nor does the desktop versus mobile variable have a large impact.
Our key findings for the eleven-point LTR item were
- No differences in means: For LTR means, we found no significant main effects or interactions. The observed difference for the scale formats was 0.06 (less than one percent of the item’s 0–10-point range), and the difference as a function of device was 0.19 (less than two percent of the item’s range).
- No differences in response distributions: Analysis of the LTR response distributions for the NPS categories of Detractors, Passives, and Promoters found no significant differences (p-values ranged from .25 to .82).
- Possible small differences may exist in other contexts: It’s premature to claim that differences are too small to have practical significance, especially if the research depends on having closely matched distributions across all eleven response options of the LTR scale.
- Mean differences larger than half of a point are implausible: On the other hand, the 95% confidence interval computed for the difference due to scale formats indicates that mean differences larger than half a point (5% of the item’s range) are implausible.
Acknowledgment
Thanks to Jonathan Clancy for his efforts in designing and conducting this experiment, analyzing data, and writing the initial drafts of this article.


