The mobile user experience is no longer a niche industry. It’s hard to talk about the user experience of websites and software and not consider the impact and experience of mobile devices.
We’ve presented a number of facts and insights in 2013 and 2015.
Here’s an updated and expanded version culled from many sources on the Internet and our own mobile usability studies.
- Between 57% and 68% (depending on the source) of U.S. adults own a smartphone. The rate is around 64% for the UK and 54% for Germany. This differs by age, with some 88% of millennials (age 18-34) owning a smartphone.
- Smartphone ownership rates in emerging and developing nations are rising at an extraordinary rate, climbing from around 21% in 2013 to 37% in 2015. Forecasters expect smartphones users to hit 2.08 billion worldwide in 2016.
- Tablet ownership seems to have leveled off, with around half the U.S. population owning a tablet. Around half of Gen Xers (35-50) and millennials own a tablet while only 25% of adults aged 70-87 do.
- Tablet browsing share was expected to overtake smartphones by 2014, but plateaued[pdf] as larger phone screens have grown in popularity. People use tablets mostly to use search engines, check email, watch online videos, and visit social networks.
- Tablets are most popular in the evening and at night. This would explain one of their primary uses compared to smartphones: tablets are used more than smartphones to read (57% on tablets and 43% smartphones) and watch videos or movies (40% vs. 30%).
- Android is still the dominant operating system with around 66 percent market share in the U.S. (up from 2015). Its international market share is even higher. In major Chinese urban areas, Android phones had 77 of the market. In the top five European markets (U.K., France, Germany, Italy, and Spain), Android’s market share is around 75% percent.
- On average around 27 apps are used per month and around 6-10 are used in a week. Apps drive the vast majority of media time spent on mobile devices, accounting for about seven of every eight minutes. People spend, on average, about 40 hours a month on their mobile apps.
- Mobile applications are predominantly used for killing time, and most people forget what apps they even downloaded. Yet 30% of all online shopping purchases now happen on mobile phones.
- The most downloaded apps are dominated by social media: WhatsApp (41.2 million), Messenger (39.3 m), Facebook (36 m), Snapchat (27.0 m), and Instagram (25.6 m). Facebook dominates usage with some 125 million unique monthly visitors. Half of the time is spent on a single app, and 80% is spent on the top three apps. Despite the popular reporting of Uber and Lyft, only 15% of U.S. adults have used a ride-hailing app while most have used it for researching a health condition (62%) or for online banking (57%). And this month, Pokemon GO is breaking records for its daily active users.
- Users’ time spent on smartphones continues to increase (especially around the holidays), and people still prefer shopping on mobile websites to apps noted by 58% of mobile revenue coming from mobile websites versus native applications.
- Most (72%) smartphone shoppers research an item before they make a purchase, including those who check item prices (70%) and those who locate a store to make their desired product purchase (60%).
- Conversion rates from tablets are still higher than smartphones. The difference is similar to 2015 with tablets having a higher conversion rate than smartphones (4% versus 1.5%), which is similar to the traditional PC conversation rate of 4.7%.
- Device switching is very common with some 53% switching between two devices to complete tasks or activities, and 77% of those with three devices doing the same. The primary reasons for switching are task specifics, location, and the need for a larger screen or keyboard.
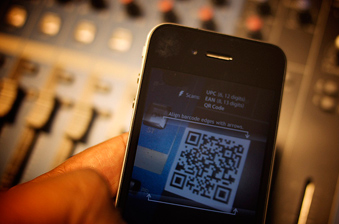
- QR codes still aren’t terribly popular with just 29% of U.S. shoppers scanning to check availability, order item, or get product information.
- Though portrait orientation is slightly more preferred to landscape (60% versus 40%), users noted that how they hold their devices depends both on the device size and on the activity, such as watching videos, playing games, reading, or web browsing.


