 We’ve written extensively about the System Usability Scale (SUS).
It’s the most widely used and cited questionnaire for measuring the perception of the user experience.
But likely the second most widely used and cited questionnaire, with over 2,000 citations, is the Post Study System Usability Questionnaire (PSSUQ). It also goes by the name of Computer System Usability Questionnaire (CSUQ).
MeasuringU Press is proud to have published Jim Lewis’s comprehensive overview of the development and usage of this influential questionnaire. The book, Using the PSSUQ and CSUQ in User Experience Research and Practice, is available for purchase on Amazon and on our website. The book contains practical guidance on how to use the PSSUQ, including benchmarks and how to conduct statistical analysis in SPSS and R when comparing interfaces.
Here are 10 things to know about this influential measure.
1. Jim Lewis developed them at IBM in the 1980s. The PSSUQ and CSUQ were developed by Jim Lewis in the late 1980s as part of an early user experience research project at IBM. They are popular questionnaires for the assessment of perceived usability and then later published in 1995. Like the SUS, the PSSUQ is technology agnostic, meaning it can apply to any interface—hardware, software, mobile apps, or websites.
2. The PSSUQ and CSUQ are similar; they differ primarily in item tense. The two questionnaires are very similar. Both have 16 items (as shown below) and use the same response scale. The main difference is in the tense of the items. The PSSUQ wording is appropriate for use at the end of a standard task-based usability study and the items are phrased in past tense to reference the just completed tasks (e.g., I was able to use this system). In contrast, the CSUQ wording is appropriate for surveys and field research and the items are worded in present tense (e.g., It is simple to use the system).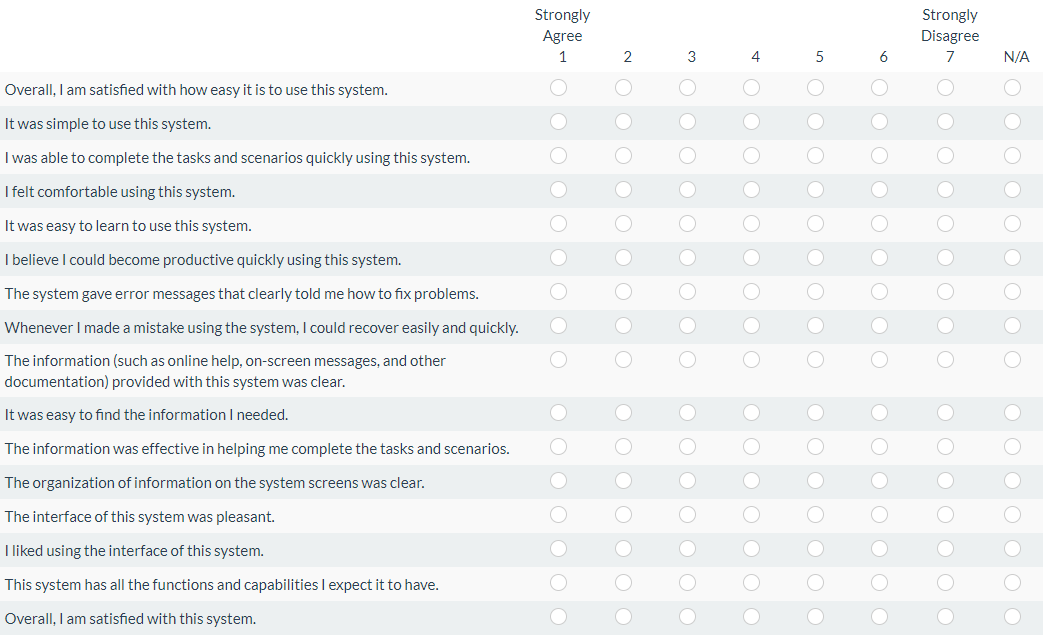
3. They each employ a seven item response scale (lower is better). Both questionnaires use a seven-point response scale with lower scores indicating better performance. (The questionnaire also contains a N/A if people feel they cannot answer the item.) This is uncommon, as most other questionnaires use high numbers to indicate a better score (e.g., the SUS and SUPR-Q). Recent research has shown that putting the better response options on the left doesn’t affect the magnitude of measurement, although it appears to increase the number of response errors. Jim has noted that if he were able to change one thing about these questionnaires, it would be to reverse the endpoints of the items, as was used by Tullis & Albert in Measuring the User Experience. Despite being composed of only positive-tone items, the PSSUQ and CSUQ don’t appear to be affected by response bias and are not affected by differences in gender or the completeness of questionnaire responses.
4. The result is a global score with three subscales. The PSSUQ provides an overall score (similar to the SUS) by averaging all 16 items, but it also has three subfactors: System Usefulness (items 1–6), Information Quality (items 7–12), and Interface Quality (items 13–15)—the 16th item is used only in the global score. Factor analysis across multiple studies has consistently found these three factors (items clustering into these three groups), which form the statistical basis for three subscales. Note that our earlier work on the SUS initially found two factors, but later studies found the factors were really just artifacts of the negative item wording (Lewis & Sauro, 2017). This is not the case with the PSSUQ because all its items have a positive tone.
5. They offer both high reliability and a translated version. The PSSUQ has exhibited high internal reliability. The reliability of the overall score with 16 items is alpha = .96; System Usefulness (.96); Information Quality (.92); and Interface Quality (.83). The lower reliability for Interface Quality is most likely a function of its using fewer items (only three), as reliability increases with more items. The CSUQ has been formally translated into Turkish following the psychometric validation procedure for translating questionnaires.
6. The PSSUQ is sensitive. The PSSUQ and CSUQ are able to detect differences (i.e., they are sensitive) across a large number of variables such as the type of system used, user group, years of use, range of experience with different systems, stage of system development, and type of evaluation. Sensitivity is one of the important qualities to assess the quality of a measure. Measures should be able to detect known differences. While not all differences are necessarily practical, you don’t want a blunt instrument, and the PSSUQ has shown repeatedly to be sensitive.
7. It’s effective at small sample sizes. Like most multi-item questionnaires, the PSSUQ can be used with both large sample sizes (more than 100) and with smaller sample sizes (fewer than 15). The main difference is the level of precision obtained. In a 2004 study, Tullis & Stetson used the CSUQ to compare two financial websites, and they found a sample size of 12 generated the same results as a larger sample size 90% of the time. This capability to detect differences is a consequence of its high sensitivity.
8. Some benchmarks are available. Preliminary norms published for the PSSUQ and CSUQ (Lewis, 2002) used its original scoring system in which scores can range from 1 to 7, with lower scores indicating a better user experience than larger scores. For this set of norms, the mean overall rating was 2.82 with a 99% confidence interval ranging from 2.62 to 3.02. The means (and 99% confidence intervals) for the subscales were 2.80 (2.57–3.02) for System Usefulness, 3.02 (2.79–3.24) for Information Quality, and 2.49 (2.28–2.71) for Interface Quality.
9. They correlate highly with the SUS and other UX metrics. Research since 2016 has consistently shown substantial correlation between concurrently collected System Usability Scale (SUS) and CSUQ scores (after conversion to a common 0-100 point scale), allowing the PSSUQ and CSUQ to “piggy-back” on norms originally published for the SUS. The PSSUQ scores also correlate significantly with task-based measures (e.g., After Scenario Questionnaire; r = .8) and completion rates (r = .4).
10. They can be used anytime. Researchers should consider using the PSSUQ/CSUQ when they want a license-free, general measure of perceived usability with known benchmarks. Other questionnaires are shorter but only provide one global score (e.g., the SUS) or two factors (e.g., the UMUX-Lite). With the PSSUQ/CSUQ’s 16 items you get a global score and three subscale scores that have been shown to be stable across studies: information quality, interface quality, and system usefulness.
Purchase a hard copy or Kindle version on Amazon or a digital (PDF) copy from our website.


