Will users purchase an upgrade? What features are most desired? Will they recommend the product to a friend? Part of measuring the user experience involves directly asking users what they think via surveys. The Web has made surveys easy to administer and deliver. It hasn’t made the question of how many people you need to survey any easier though. One common question is “How many people do I need to survey to have a representative sample?” This question mixes two concepts: representativeness and sample size.
Representative: Are you asking the right people?
It is much better to ask a few of the right people what they think than a lot of the wrong people. Some things to consider are:
- Do your respondents have the authority to make purchasing decisions?
- Are you surveying a user or system administrator?
- Are only people from North America responding to your survey about international issues?
Representative samples mean asking the people in your population of interest. It has less to do with the right sample size than with the right target. Spend more of your time on identifying, finding and asking the right people than on finding the right sample size. Ideally you can select your respondents from the appropriate population in some random way, although even randomness is less important than representativeness. For example, you could select every third member on a mailing list of representative users.
Sample Size: How Precise do you need to be?
Once you’re fairly confident you’re talking to the right people, you can ask how many you need to survey. For single-shot surveys when no comparisons are being made (e.g., to prior surveys or benchmarks) sample size is all about how precise you need to be. The more precise you need the estimate the more people you need. The calculation is basically a backwards confidence interval. Confidence intervals are made up of a confidence level (typically 95%) and a margin of error. The margin of error is how precise you need to be.
You can’t be 100% precise
The only way to be 100% accurate (a 0% margin of error) with your survey results is to survey everyone. Unless you’re the government this is probably not an option. Instead you have to deal with some margin of error. You need to find the highest margin of error you or the survey sponsor is comfortable with. To do this answer the following question:
Is it OK if your response averages could be off by +/-1%?
How about +/- 5% ?
How about +/- 10% ?
How about +/- 20% ?
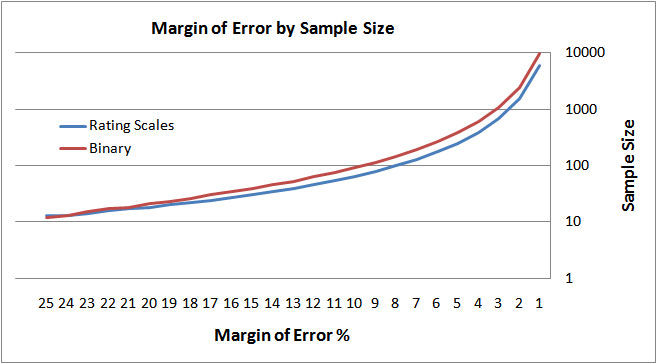
The point just before you are no longer comfortable with the level of error in your estimate is where you stop. Once you have the largest margin of error you can tolerate, just use the following table to approximate the sample size you need. For more precise estimates you download an Excel Calculator and 23-page guide on how to perform the calculations.
| Margin of Error (+/-) |
Rating Scale Sample Size |
Binary (50%) Sample Size |
| 1% | 6073 | 9600 |
| 3% | 686 | 1064 |
| 5% | 249 | 381 |
| 10% | 64 | 93 |
| 15% | 30 | 39 |
| 20% | 18 | 21 |
Example 1 : Rating Scale
For example, if you’re asking respondents to rate how satisfied they are with a service on a 7-point scale, and want no more than a 5% margin of error, then you’ll need to plan on obtaining 249 responses. Of course not everyone who is asked to fill out a survey responds. A response rate of 10% would mean you should plan on sending the survey to around 2500 people. You can certainly achieve a higher response rate through a more targeted list. In a recent survey I conducted where participants opted-in to a list, I achieved a 60% response rate.
Example 2: Binary Response
If you were asking users whether they would use your service in the future (yes or no) and want a 3% margin of error around the actual percentage, then plan on getting around 1064 responses (meaning you’d need to send it to close to 10,000 people if you have only a 10% response rate).
If your questions are a mix of both rating scales and binary response choices (yes/no agree/disagree), then use the binary sample size because it is always larger than the rating scale sample size.
The graph below plots the relationship between the margin of error and sample size for both binary and rating scale responses. You can use it to approximate any sample size between margins of error of 1 and 25% or download the excel calculator and PDF guide to get more precise calculations.
If obtaining additional respondents is costly then you’ll need to revisit the question of the highest margin of error you or the sponsor is comfortable with or find ways to increase the response rate, such as offering an incentive. Sample size calculations are all about balancing precision with cost. When you need to limit your cost you’ll need to deal with more uncertainly in your estimate.
More about Sample Sizes for Surveys
The graph and tables above were calculated using a common formula for finding the sample size. A few assumptions were made based on the typical variability observed with rating scale response patterns such as the confidence level (95%) and the typical amount of variability in a population. If you’d like more information on how to calculate your own sample size you can download the Survey Sample Size package. It contains a 23-page step-by-step calculation guide with plenty of examples and practice questions–plus an Excel calculator which find the sample size for both binary responses and rating scales.


