 What do you think the most common question in statistics is?
Several times a year I teach a statistics course for UX professionals and get asked this question a lot.
We’re offering the class this fall at the LeanUX Denver conference and a portion of it is available for download.
Some attendees have had statistics classes and for others it’s their first one. Regardless of the background, almost everyone who uses statistics wants to know: What statistical procedure do I use?
It’s hard enough to grasp many of the concepts in statistics. Most people in UX aren’t math majors and never intended to use statistics as part of their job.
For this reason we have a decision tree to help you know when to use which statistical procedure in both the Excel calculator and in Chapter 2 of our book Quantifying the User Experience.
Getting to know the decision map is one of the most popular parts of the course because you can click right to the appropriate calculator after answering a couple questions, paste your data and get your answer.
I’ve included a similar clickable version below with links to several of our free online calculators. To use the decision map you just need to know a few things.
What type of Data do you have?
For this decision map, the primary thing you need to know is if your data is binary or not.
- Binary (pass/fail, yes/no, purchase/didn’t purchase) and coded as 1 or 0. These include things like completion rates and conversion rates.
- Continuous: If your data isn’t coded as 1’s or 0’s then we can usually treat it as what’s called continuous or metric data.
Once you’ve established whether your data is binary or continuous, you start with the appropriate decision map below. The rest is just answering a couple questions about what you’re trying to do. Four examples follow the decision maps to give you some practice.
The blue boxes at the termination points on the two decision maps below link to our free online calculator and if I don’t have one up yet (more coming soon!) it will link to the Excel calculator.
You can also download a free high-resolution printable version [3.5MB pdf] of both maps. Pin it to your wall for help or throw darts at it if statistics just frustrates you too much.
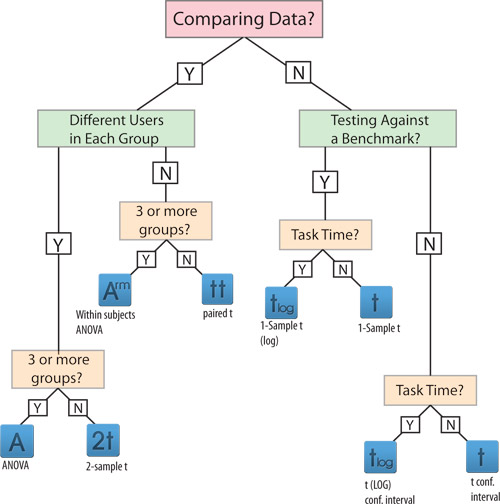
Continuous Data Decision Map
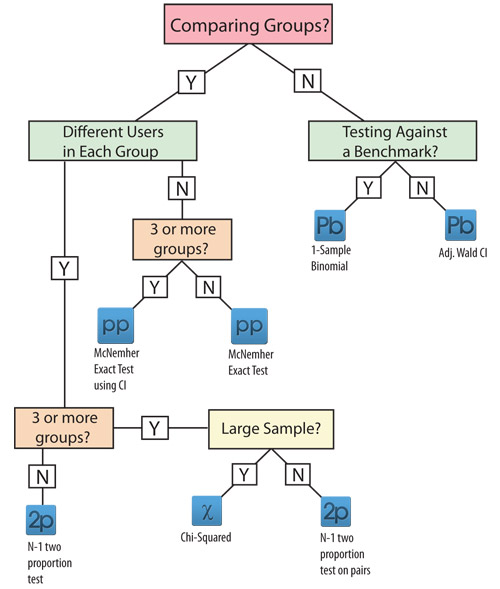
Binary Data Decision Map
Example 1
Let’s say you had a rating scale question in a survey that went from strongly disagree to strongly agree and was coded from 1 to 5 for each level of agreement. The average score was a 3.9 (sd = 1.2) from 36 people. What test would you use to find out how much that sample mean would fluctuate?
- It’s not a binary measure so we’d use the continuous decision map.
- We aren’t comparing data, we only want to know how precise our estimate is so we pick “N” in the first branch.
- We don’t have a benchmark we’re testing against (such as testing whether the average exceeds 3.5) so we again pick “N”.
- The data isn’t task time so we pick “N” and end up at the t confidence interval link. Entering in the mean, standard deviation and sample size as summary data gets us a 95% confidence interval from 3.494 to 4.306.
Example 2
Let’s say you had two different groups of users who attempted to locate the nearest rental car location. In one group 12 out of 12 users found the correct location on Budget.com. In another group, 17 out of 24 found the correct location on Enterprise.com. Is there a statistically significant difference between rental car websites?
- Completion rates are a binary measure (pass/fail) so we’d use the binary decision map.
- We ARE comparing groups—we want to know if users on different websites will have different completion rates when finding a location so we pick the “Y” in the first branch.
- We have different users in each group (called Between Subjects) so we pick “Y” again.
- We have only 2 groups so we pick “N” at the 3 or more groups box.
- We end at the N-1 Two Proportion Test with a link to the A/B Test calculator link. Entering 12 out of 12 and 17 out of 24 gets us a p-value of .03985, which means the difference is statistically significant.
Example 3
Let’s say you watched as 20 out of 25 people found a Brother Sewing Machine in a tree test from Optimal Workshop. Is there evidence that at least 75% of all users would find the Sewing Machine?
- Completion rates are a binary measure (pass/fail) so we’d use the binary decision map.
- We are not comparing groups so we pick the “N” in the first branch.
- We ARE testing against a benchmark of 75% so we pick “Y” again.
- We end at the 1 Sample Binomial Test with a link to the One Proportion Calculator. Entering 20 out of 25, “Is Greater Than” and a Test Proportion of .75 tells us there’s about a 70% chance at least 75% of all users would be able to find the Sewing Maching–not terribly compelling evidence.
Example 4
Let’s say you administered the System Usability Scale (SUS) after users spent time using an accounting application. You tested 15 users on an old version and 17 on a new version and wanted to know if there was evidence that users thought the new version was easier to user. The SUS means and standard deviations were 68 (sd=14) and 76 (sd =12) on the respective versions.
- SUS scores are not binary so we’d use the continuous decision map.
- We ARE comparing groups so we pick the “Y” in the first branch.
- We have different users in each group (called Between Subjects) so we pick “Y” again.
- We have only 2 groups so we pick “N” at the 3 or more groups box.
- We end at the 2 Sample t test with a link to the online calculator. We enter the summarized values and get a p-value of .0962 which means there’s good, although not overwhelming evidence, that the difference is statistically significant.


