 What do customers want?
It’s the million dollar question with what seems like a million answers.
Prioritizing product features, including conducting a top-tasks analysis, is an essential step in creating the optimal product and experience.
During the prioritization phase, our clients will on occasion specifically ask for a conjoint analysis. As data geeks, we love advanced methods like conjoint, but many researchers are unfamiliar with how it works and how to interpret the results.
There are in fact, different types of conjoint studies, and I’ll discuss three of them here: Full Profile Conjoint, Adaptive Choice Based and MaxDiff.
The idea behind techniques like conjoint analysis is to break down products, websites, or services into smaller components to understand what’s the most important to your customers. With a conjoint analysis, you describe features that are meaningful to the respondents and then ask them to rate how important each combination of features are.
Before getting into conjoint, it helps to see how it’s an extension of the more familiar technique: multiple regression analysis.
Multiple Regression Analysis
Often called the workhorse of applied statistics, multiple regression analysis identifies the best weighted combination of variables to predict an outcome. Participants rate their satisfaction with the features or attributes, along with the main dependent variable like customer satisfaction or likelihood to recommend.
You can use any survey software to present the questions. Software like SPSS, Minitab, or R are recommended for running the regression analysis from the output. Using this method, feature ranking isn’t explicit to the participant, but is instead derived from the correlations between the features that the participants rate.
For example, we had customers answer the 8-item SUPR-Q, a measure of website quality, after using one of four popular airline websites (Delta, United, Southwest, and American). We wanted to know what aspects of the online experience best predicted the SUPR-Q scores. We also had them rate their satisfaction with eight major aspects of the online reservation system:
- Choosing a Seat
- Making a Reservation
- Checking In
- Changing a Reservation
- Speed of the Site
- Calendar
- Finding Contact Information
- Redeeming Miles
To understand which aspects had the biggest relative impact on ratings, we conducted a multiple regression analysis. Across the 230 participants in the study, we found two features didn’t have a statistical impact (Redeeming Miles and Finding Contact Info) and the rest were about equally weighted in their ability to predict SUPR-Q scores. The speed of the website and ease of using the calendar both ranked as the most important as shown in the table below.
| Feature |
Beta Weights |
Importance (out of 100%) |
| Calendar | .11 | 19% |
| Speed | .11 | 18% |
| Choosing A Seat | .10 | 17% |
| Making A Reservation | .10 | 17% |
| Checking In | .10 | 16% |
| Changing Reservations | .08 | 13% |
The table shows the relative importance of each of the features. The beta weights are a standardized measure of how much each variable impacts the SUPR-Q. For example, a one unit increase in satisfaction with the calendar experience will improve the SUPR-Q score by .11 points. The percentage column takes the beta weight for the feature divided by the total beta weights for all features to present a more interpretable value for stakeholders.
These weights can also be displayed in a key-driver analysis, another advanced technique. If you’re interested in the mechanics behind multiple regression analysis, see the appendix of my book Customer Analytics For Dummies.
Full Profile Conjoint Analysis
A conjoint analysis extends multiple regression analysis and puts the ranking front and center for the participant. It helps identify the optimal combination of features in a product or service. Participants rate or force rank combinations of features on a scale from most to least desirable. The scales can be for likelihood to purchase, likelihood to recommend, overall interest, or a number of other attitudes.
A conjoint analysis is made up of factors and levels:
- Factors are the variables you think impact the likelihood to purchase or recommend.
- Levels are values assigned to each factor.
For example, to understand the best combination of factors when selecting an airline ticket, common ticket factors might include: class of service, price, number of stops, and airline brands. Two levels for the number of stops would be nonstop and one stop. An example of four factors, each with two levels for purchasing an airline ticket from Denver to Tokyo is shown in the table below.
| Factor |
Level |
| Brand | United, Singapore |
| Stops | Nonstop, One Stop |
| Price | Low, High |
| Class | Coach, Business |
To administer a conjoint, you present all combinations of levels and participants rate or rank them. Five of the sixteen possible combinations are shown below. Participants would rate or rank which combination is most desirable for an upcoming flight from Denver to Tokyo.
| Economy 1 Stop $1,100 United |
Economy Nonstop $2,800 United |
Business Class 1 Stop $4,300 Singapore Airlines |
Business Class Nonstop $11,000 United |
Economy 1 Stop $1,800 Singapore Airlines |
When scoring the conjoint, every time a feature appears in a combination you dummy code it a 1 and when absent a 0. You can then use multiple regression analysis and ANOVA to determine both the impact each feature has on the overall desirability rating and the ideal combination of levels that drive the highest interest.
It helps to have software that can handle combinations of variables, such as Conjoint Analysis – By SurveyAnalytics, but you can also enumerate this by hand in most survey software. The output of conjoint analysis provides the highest rated or ranked combination, as well as the relative importance (called utility—the same value as the beta coefficient) of each factor just like with the multiple regression analysis output.
A major limitation with traditional conjoint analysis is that you’re limited to a few features, each with a few levels. The number of combinations of choices increases quickly. For example, the airline example has four attributes and two levels per attribute. That means participants have 16 combinations (2 x 2 x 2 x 2) to consider. Adding an additional variable, say baggage fees, increases the number to 32.
In practice, you’ll want to limit the number of combinations to less than 20; even the most diligent participant will find it difficult to rate or rank more than 20 combinations.
Adaptive Choice Based Conjoint
It’s not always easy to limit the number of attributes or levels. What’s more, participants will be indifferent toward some attributes. Maybe a participant doesn’t care about baggage fees because he never checks a bag.
A more recent modification to conjoint analysis is called Adaptive Choice Based Conjoint. Participants are presented with two to four combinations of attributes at a time. As participants fail to select attributes, they’re subsequently removed from consideration. This reduces the total number of combinations participants must rate while still providing stable estimates around the value of each attribute and the best overall combination. An adaptive choice based conjoint asking to rate airline tickets would look something like the following (compare it to the earlier conjoint analysis):
Which of the following tickets would you most likely to purchase?
| Economy 1 Stop $1,100 United |
Economy Nonstop $2,800 United |
Business Class 1 Stop $4,300 Singapore Airlines |
None of these |
MaxDiff
A final twist on conjoint is called Maximum Difference, or MaxDiff. As the name implies, MaxDiff uses a slightly different presentation and algorithm to accentuate the differences between features. Participants select both the most desirable and least desirable offering from a list of alternatives.
For example, we had 100 participants complete a MaxDiff study on the importance of features as they research and book hotels online. These features included location, star-rating, pet-friendliness, and pools. We know most of these are important attributes to consumers, but we wanted to know which were the most important. The figure below shows the results.
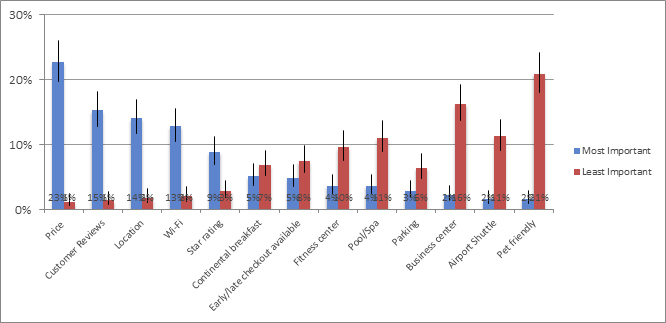
Price, customer reviews, location, Wi-Fi, and star-ratings were rated highest, with between 9% and 25% of respondents picking them as most important among the other alternatives. They were picked least important less than 3% of the time.
In contrast, an airport shuttle, business center, and pet-friendliness were selected least important at least 16% of the time and only the most important less than 2% of the time. More on scoring MaxDiff [pdf].
Summary
When you need to identify the relative importance of features in a product a conjoint analysis may provide useful results. Some things to keep in mind:
- Conjoint analysis provides information on the optimal combination and relative importance of the features. (It’s similar to a multiple regression analysis.)
- You’re limited to a few factors and levels with a traditional conjoint analysis.
- Adaptive Choice Based Conjoint allows for more levels and factors without putting the burden on the participant but it requires specialized software.
- MaxDiff is a conjoint variant that helps separate the less important features from the most important and are easy to take for participants.


