 You go to your doctor for a checkup.
You’re feeling fine but as a matter of procedure, your doctor orders a battery of tests and scans to be sure all is well. She runs 30 tests in total.
A few days later she calls and tells you one of the tests came back positive–an indication something is potentially wrong.
Now it could be that a medical issue has gone undetected. After all, many diseases have no early symptoms. But it could also be that this result is a false positive–a result that indicates a problem when in fact nothing is wrong.
While the false positive rate for any single medical test is usually low (to minimize patient agony and unnecessary tests!), the chance you’ll see at least one false positive in multiple tests turns out to be rather high.
For example, if the false positive rate for any test is 5%, the probability of at least one false positive in 30 tests is almost 80% (use the binomial probability distribution to work this out).
The danger of false positives applies to more than just blood work and pet-scans; it applies to p-values used in data science and customer experience research, too. With the proliferation of big data, the number of statistical tests we can perform seems endless. But the number of fluke discoveries we’re likely to detect has increased as well.
Managing the False Positive Rate
Fortunately, there are techniques to help manage the false positive rate when making multiple comparisons.
One of the better known is the Bonferroni correction. The idea is that you lower your threshold for significance by adjusting your p-value downward based on the number of tests you perform. It’s done by dividing the original p-value by the number of tests. If your goal is a finding (such as differences between two designs or survey questions) that’s statistically significant at p < .05 for 20 tests, your new corrected p-value becomes .05/20 = .0025. That means only p-values below .0025 become statistically significant.
This correction is intuitive and simple to compute and is used extensively by researchers in many fields. Unfortunately, it tends to overcorrect the problem by making it too difficult to declare differences as statistically significant! In protecting against the false positive rate, it increases the false negative rate! This is akin to making a medical test with such a low false positive threshold that it tends not to flag a disease.
A relatively new services that balances both false positives and false negatives is the Benjamini-Hochberg method. To use the Benjamini-Hochberg method, follow these steps:
- Rank the p-values from all your comparisons from lowest to highest.
- Create a new threshold for statistical significance for each comparison by dividing the rank by the number of comparisons and then multiplying this number by the initial significance threshold.
For example, for six comparisons using an initial significance threshold of .05, the lowest p-value, with a rank of 1, is compared against a new threshold of (1/6)*.05 = .008, the second is compared against (2/6)*.05 = .017, and so on, with the last one being (6/6)*.05 = .05. If the observed p-value is less than or equal to the new threshold, it’s considered statistically significant.
To see how this works in practice, we collected SUPR-Q scores from 10 popular U.S.-based retail websites in 2013. The raw values along with 90% confidence intervals are shown in the figure below (I used a statistical significance level (alpha) of .10 for this research).
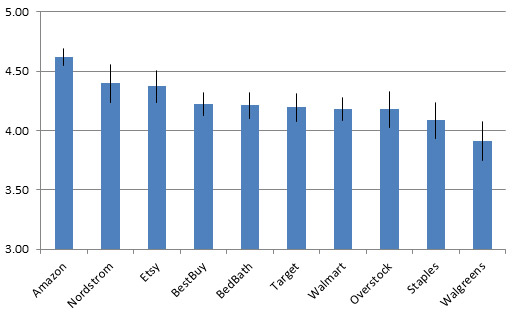
Figure 1: Raw SUPR-Q scores for 10 retail websites. Data collected by MeasuringU in 2013.
Amazon had the highest SUPR-Q score and Walgreens the lowest, but which websites were statistically different from each other? With 10 websites, there are 45 total paired comparisons and plenty of opportunity to falsely identify a difference! I computed the p-values using an unadjusted method, the Bonferroni method, and the Benjamini-Hochberg method as shown in the table below.
With the p-values ranked lowest to highest, the results were:
- Unadjusted method: Without any adjustments, 22 of the 45 comparisons were statistically significant at p < .10 (the “Unadjusted Result” column in the table).
- Benjamini-Hochberg method: Using the Benjamini-Hochberg method, 17 of the 45 comparisons were statistically significant (the “BH Result” column in the table below). The significance threshold for the Benjamini-Hochberg method is shown in the “BH Threshold” column. For example, the difference between Amazon and Etsy’s SUPR-Q score (row 11) generated a p-value of .009, which is below the Benjamini-Hochberg threshold of (11/45)*.10 = .024. Because the p-value of .009 is less than .024, we declare it statistically significant.
- Bonferroni method: With the Bonferroni method, only 9 of the 45 comparisons were statistically significant (the “Bonferroni Result” column). For example, the threshold for the more conservative Bonferroni method for the Amazon and Etsy’s SUPR-Q score (row 11) was p < .002 (.10/45), which did not flag the difference between Amazon and Etsy as statistically significant.
Table 1: 45 paired comparisons between the 10 retail website SUPR-Q scores sorted by lowest p-values. “Sig” indicates which method flagged the comparison as statistically significant.
| Rank | Site 1 | Site 2 | p-value | BH Threshold | Unadjusted Result | BH Result | Bonferroni Result |
| 1 | Walmart | Amazon | 0.000 | 0.002 | Sig. | Sig. | Sig. |
| 2 | BestBuy | Amazon | 0.000 | 0.004 | Sig. | Sig. | Sig. |
| 3 | Amazon | Target | 0.000 | 0.007 | Sig. | Sig. | Sig. |
| 4 | Amazon | BedBath | 0.000 | 0.009 | Sig. | Sig. | Sig. |
| 5 | Amazon | Overstock | 0.000 | 0.011 | Sig. | Sig. | Sig. |
| 6 | Amazon | Staples | 0.000 | 0.013 | Sig. | Sig. | Sig. |
| 7 | Amazon | Walgreens | 0.000 | 0.016 | Sig. | Sig. | Sig. |
| 8 | Etsy | Walgreens | 0.001 | 0.018 | Sig. | Sig. | Sig. |
| 9 | Nordstrom | Walgreens | 0.001 | 0.020 | Sig. | Sig. | Sig. |
| 10 | BestBuy | Walgreens | 0.009 | 0.022 | Sig. | Sig. | |
| 11 | Amazon | Etsy | 0.009 | 0.024 | Sig. | Sig. | |
| 12 | BedBath | Walgreens | 0.013 | 0.027 | Sig. | Sig. | |
| 13 | Nordstrom | Staples | 0.018 | 0.029 | Sig. | Sig. | |
| 14 | Etsy | Staples | 0.020 | 0.031 | Sig. | Sig. | |
| 15 | Walmart | Walgreens | 0.023 | 0.033 | Sig. | Sig. | |
| 16 | Target | Walgreens | 0.024 | 0.036 | Sig. | Sig. | |
| 17 | Amazon | Nordstrom | 0.037 | 0.038 | Sig. | Sig. | |
| 18 | Overstock | Walgreens | 0.051 | 0.040 | Sig. | ||
| 19 | Walmart | Nordstrom | 0.054 | 0.042 | Sig. | ||
| 20 | Walmart | Etsy | 0.060 | 0.044 | Sig. | ||
| 21 | Target | Nordstrom | 0.090 | 0.047 | Sig. | ||
| 22 | Nordstrom | Overstock | 0.095 | 0.049 | Sig. | ||
| 23 | Target | Etsy | 0.105 | 0.051 | |||
| 24 | BedBath | Nordstrom | 0.108 | 0.053 | |||
| 25 | Etsy | Overstock | 0.114 | 0.056 | |||
| 26 | BestBuy | Nordstrom | 0.117 | 0.058 | |||
| 27 | BedBath | Etsy | 0.127 | 0.060 | |||
| 28 | BestBuy | Etsy | 0.138 | 0.062 | |||
| 29 | Staples | Walgreens | 0.200 | 0.064 | |||
| 30 | BestBuy | Staples | 0.207 | 0.067 | |||
| 31 | BedBath | Staples | 0.255 | 0.069 | |||
| 32 | Target | Staples | 0.345 | 0.071 | |||
| 33 | Walmart | Staples | 0.381 | 0.073 | |||
| 34 | Overstock | Staples | 0.471 | 0.076 | |||
| 35 | Walmart | BestBuy | 0.616 | 0.078 | |||
| 36 | BestBuy | Overstock | 0.682 | 0.080 | |||
| 37 | Walmart | BedBath | 0.716 | 0.082 | |||
| 38 | BedBath | Overstock | 0.757 | 0.084 | |||
| 39 | BestBuy | Target | 0.768 | 0.087 | |||
| 40 | Etsy | Nordstrom | 0.836 | 0.089 | |||
| 41 | Target | BedBath | 0.857 | 0.091 | |||
| 42 | Walmart | Target | 0.877 | 0.093 | |||
| 43 | Target | Overstock | 0.884 | 0.096 | |||
| 44 | BestBuy | BedBath | 0.909 | 0.098 | |||
| 45 | Walmart | Overstock | 0.982 | 0.100 |
This illustrates how the Benjamini-Hochberg method strikes a good balance between the unadjusted p-values (which will give too many false positives over time) and the more conservative Bonferroni method (which generates too many false negatives over time) and is why I recommend it for managing false positives.
We talk more about making and managing multiple comparisons and false positives in our Rome and Denver UX Boot Camps and in the 2nd Edition of Quantifying the User Experience.
The next time you find yourself making a number of statistical comparisons (especially unplanned ones) or the subject of a number of medical tests, consider the Benjamini-Hochberg correction to help ensure your conclusions aren’t just false positives.