 Finding and fixing usability problems is fundamental to improving the user experience.
How common problems are (the frequency) and how impactful they are (severity) should be treated independently in order to meet that goal.
While it’s generally straightforward to count how many times you observe a problem in a usability test, assigning severity ratings to problems can be more challenging.
Most usability tests will uncover many problems (our reports typically contain 15 to 30). There are often too many problems to fix. Severity ratings help development teams prioritize what does and doesn’t get fixed.
Here are five steps to follow for establishing a system for assigning problem severity after observing problems in a usability test.
1. Agree on a severity scale
There are a number of ways to rate the severity of a usability problem. Just about any type of system that designates different levels of severity will work. It can be as simple as low, medium, high or range from 1 to 3, 1 to 5, or 1 to 7. If your organization has a convention or a system used by developers, use that.
If you establish your own scale, it’s helpful to define what each severity level means. For example, any problem that leads to task failure could be designated as a 1. Cosmetic issues are a 3. It doesn’t matter whether you use higher or lower numbers to indicate more intense severity—just be consistent.
2. Train evaluators
You need to make sure that the people judging the severity of usability issues are familiar with the severity scale, have observed users interacting with the interface, and ideally know something about the domain being studied (e.g. retail websites, financial apps). Have documentation and calibrate your evaluators. For example, you can have a set of sample problems with an existing agreed-upon severity rating. Have new evaluators rate enough sample problems until they’re consistently rating the severity with the existing levels.
3. Have at least two evaluators rate independently
A trivial issue to one can be critical to others. Have evaluators rate the usability problems separately using the agreed-upon severity scale.
Where there’s judgment, there’s disagreement. Even highly trained specialists disagree on diagnosing diseases. This is the case with both identifying usability problems and assigning severity ratings. Using independent evaluators will uncover areas of disagreement and allow teams to identify and potentially reconcile differences.
Often it’s not possible or necessary to reach agreement. Instead, the differing perspectives can be helpful in reflecting the fuzzy nature of judging interface usability.
4. Evaluate agreement
Compute the correlation between each evaluator to assess agreement. For example, here are ratings from two evaluators who assessed the severity of an iPad application. There were 31 problems uncovered. Each evaluator worked independently using a 3-point severity scale, where a 1 represented the most severe issues and a 3 for the minor issues.
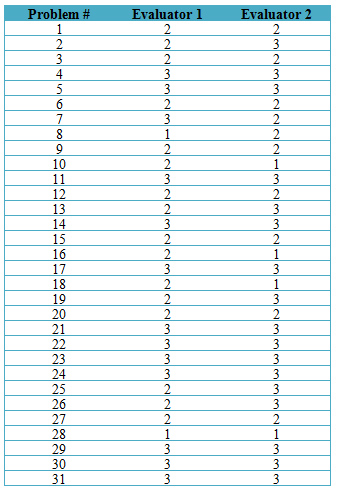
The Pearson correlation is one measure of agreement; for this data it’s r = .64, which suggests reasonably good agreement. While experts disagree, you don’t want consistently low levels of agreement. Aim for above r = .5. To improve agreement, you may need to train the evaluators to apply the scale properly and better understand the impact of observed problems for the domain being tested.
If you can achieve consistently high inter-rater reliability (r > .8), then there’s less gained by using multiple evaluators as there’s such high redundancy in the ratings. We typically see high reliability when working with companies on the same interface over time; using a single evaluator is fine in that situation. Some problems repeat across rounds of testing, so there’s little disagreement on their severity once they’ve been established in prior rounds.
Technical note: For severity ratings with 3 points, the simple correlation coefficient or Spearman rank correlation (in this case rho = .66) are artificially attenuated (underrepresenting the true association of the more underlying continuous relationship). The polychoric correlation can be a better measure of association but requires special software to compute (e.g. in R). With this data the polychoric r is .81 and better quantifies the strong association you can see from quickly eye-balling the table.
5. Average or reconcile the differences in ratings
With ratings collected from ideally at least two evaluators, you’ll want to reconcile differences or average the ratings to report one. For example, for problem #2 in the example above, Evaluator 1 rated the severity a 2 (middle severity) and Evaluator 2 rated it a 3 (least severe). The two evaluators can rationalize their ratings with each other and pick either 2 or 3 to report to the client.
Alternatively, you can err on the side of more severe ratings by rounding down, or rounding up for less severe. Your services depends on the context. Often just providing some well-reasoned method that separates the critical from the cosmetic serves the purpose of helping development teams prioritize.


