 There are many helpful books on usability testing.
It is also helpful to know what actually happens in usability tests, including what metrics people collect.
I asked MeasuringU newsletter subscribers to answer a few questions about how they measure usability. Sign up for weekly updates at the bottom of this page.
In addition to the number of users tested, I also asked about what data they collected in their most recent formative and summative usability tests. Here are the results.
Formative Tests Metrics
In total 97 people reported the metrics they collected in their most recent formative test. Not surprisingly, most users collected User Interface problems–which tell you what to fix to make an interface more usable. But roughly the same proportion recorded completion rates. Completion rates are easy to collect, interpret, and work well for comparing simple prototypes to completed systems.
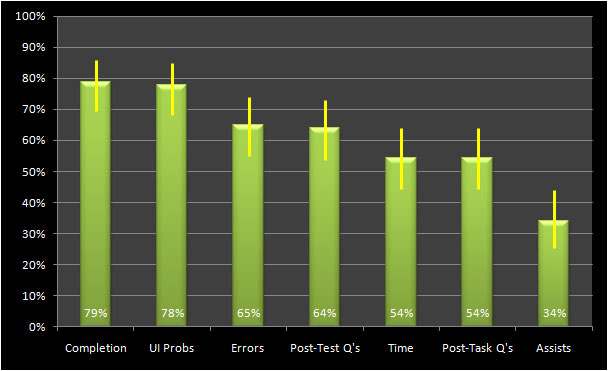
Figure 1: Proportion of respondents who collected the metric in a formative test and 95% confidence intervals.
Also interesting, over half of respondents reported collecting task time in a formative test. Task time is typically not thought of as a metric collected in formative tests–where interfaces are often prototypes and users think aloud. Yet, task time in formative tests can still be an excellent diagnostic measure (especially when compared between design-iterations).
The category “Post Test Q’s” refers to Usability Questionnaires administered after a usability test, such as the popular System Usability Scale (SUS). Post-Task Q’s refer to questionnaires asked immediately after the task.
Additional Metrics Collected
In addition to the metrics cited above, below is a list of additional metrics respondents reported collecting in formative tests:
- a system capability index
- preference
- information relevance
- number of back presses
- help access
Summative Tests
In total 69 respondents reported metrics for their latest summative usability test. The graph below shows more emphasis on performance metrics although respondents still collect User Interface problems. Even during benchmarking it usually makes sense to collect problems users are having with an interface.
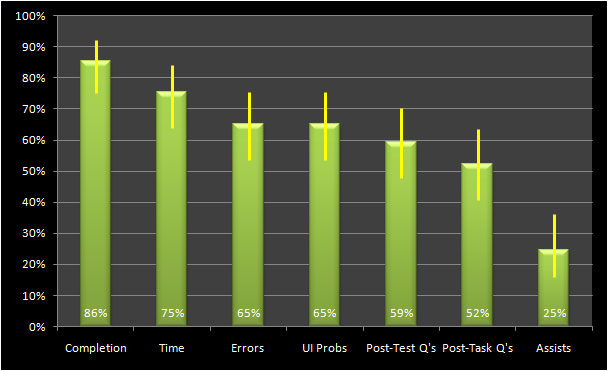
Figure 2: Proportion of respondents who collected the metric in a summative test and 95% confidence intervals.
Additional Metrics Collected
In addition to the metrics cited above, below is a list of additional metrics respondents reported collecting in summative tests:
- Words Recognition Rate
- Reported expectations and performance
- Facial reaction
- Number of back presses
- Gap satisfaction
- Path’s taken as a measure of scent
- Work-flow matches mental model or not
Summative vs. Formative Metric Collection
The graph below shows the difference in the types of metrics collected during both types of usability testing. There is a lot of similarity in the type of metrics collected with the largest difference coming in the percent recording task time. Around 50% more people report collecting task time data in summative tests.
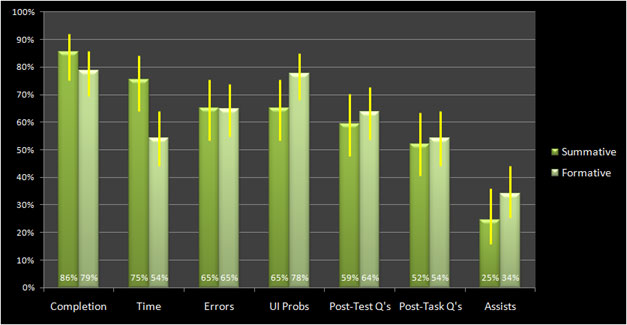
Figure 3: Comparison of proportion of respondents who collected the metric in a formative vs summative tests and 95% confidence intervals.
Corroborating Data
The sample of subscribers to measuringu.com probably focus more on metrics than the general population of usability testers. To get an idea of how representative these results were, I looked back at the 97 summative datasets Jim Lewis and I used in the 2009 CHI paper[pdf].
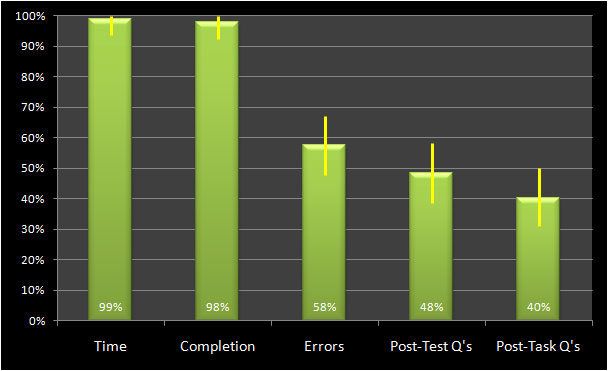
Figure 4: Proportion of datasets that contain the metric in a collection of 97 summative tests and 95% confidence intervals.
There were a higher percentage of datasets with task time and completion rate data. The proportion of datasets that collected errors and some form of usability questionnaire were similar. Both the survey results and the earlier analysis provide a reasonably consistent picture of how usability is measured.


