 Was all that effort worth it?
Showing a return on an investment (ROI) is a good thing, but not always an easy thing to do.
One of the most difficult parts of calculating a return on investment from UX efforts is that you need to isolate the influence of UX efforts on revenue to show causation.
The strongest case for establishing causation is using a randomized controlled experiment. This would be like developing two simultaneous software products that do the same thing, applying UX methods to one (usability testing, personas, or pick the method) but not to the other. Randomly assigning which customers got which product and replicate the experiment a number of times.
Most cases of UX ROI we hear about are sequential non-controlled experiments. It’s hard to know if the user experience improvements actually led to increased revenue or if the product would have gotten the revenue anyway from other variables like an expanding market, self-selected beta users, or already increasing sales.
While marketing experiments that offer the control needed to establish causation have been around for decades, the time and cost of obtaining data from enough participants limited their use. The web has made real time randomized controlled experiments a lot easier. We usually call them A/B tests.
In a classic web-based A/B test, participants are randomly assigned to one design (called A) or the other (called B). In some, but not all cases, what’s being compared is the effect of a design after it’s been tested in a lab, and redesigned after research, feedback, or some UX method has been applied. You can then take the costs associated with a design and see how it is offset or returned by the new gains or losses.
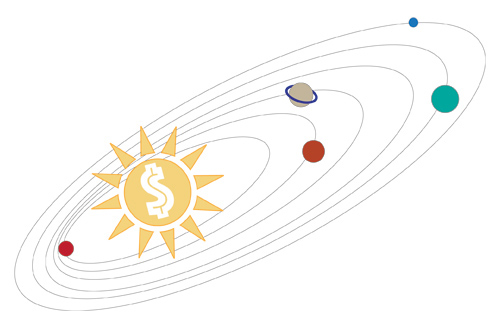
The Planetary Model of ROI
To calculate the gains (or losses), the following metrics are all tied directly or indirectly to revenue, through new sales, cost savings, or cost avoidance. Think of the metrics like planets in our solar system. The sun at the center represents revenue. The closer-in planets get more direct sunlight and are tied more closely to revenue. The farther away from the sun you get, the weaker the light and consequently the case for ROI.
While these ten metrics can be used for software or hardware, they’re most commonly used with websites and web applications to help quantify the ROI of UX efforts. We’ve listed them from the closest to furthest from revenue.
Purchase Rate
Purchase rate is the classic A/B test metric where the number of people who make a purchase is divided by the number of people who had the opportunity to purchase. If 1000 people visit a product page and 10 make a purchase, the conversion rate is 1% (10/1000). The strongest case you can make for UX ROI is in a randomized A/B test with a design that generates a higher percent of purchases. I’ve worked with companies like PayPal to help analyze and optimize UX efforts around this metric alone. This is the Mercury of ROI metrics.
Total Number of Purchases/Transactions
While conversion rates are the most common metric, they’re usually a proxy for more purchases. You don’t want a new design that converts a higher percentage of people to purchase, but the total number of people that make a purchase goes down! You need to be sure you’re optimizing around the right metric. I call this the denominator problem. In this case, there is some evidence a change to a form from usability testing resulted in an increase of 300 million in revenue.
Average Order Value
All conversions are not created equal. While you want more conversions and more total purchases, you don’t want the typical amount a customer purchases to go down. We call this conversion cannibalism. You want to track the average sales a design change makes and be sure that stays the same or goes up relative to a control condition.
Reduced Cart Abandonment Rate
Consumers add items to carts for a number of reasons; a lot of times items are saved for later consideration. But chances are if an item’s in the cart, there’s an interest in purchasing. You don’t want customers abandoning their items and never purchasing them. This is another type of conversion rate like purchase rates; you’ll want to show that a lower number of abandonments are associated with UX efforts. You’re around Venus here.
Reduced Calls to Support
This is a classic cost avoidance metric. There are usually a plethora of metrics on support calls, and one of them is usually how much a call costs an organization. Customers don’t want to call support and companies don’t want customers to call support. Autodesk found that a two-day usability test and quick design change reduced the number of calls to tech support.
Registrations
Not every step in the customer journey is directly tied to revenue or sales. Registering for a webinar, an email newsletter, or for a call back from a sales rep are important steps in a sales process. To get more sales you need more qualified leads. A good sales funnel estimates the number of leads that convert to actual sales and therefore creates the linkage to revenue and your ROI calculations. As far as closeness to revenue, consider this Mars–it’s getting colder.
Click-Through Rate
Getting more people to click and consider your product or content can be the first step in the sales process. A new design based on research that increases click-throughs can be an ROI metric. When click-through rates don’t result in a sale however, they are about as far out as Saturn in measuring ROI. At least there’s some evidence of a call to action here, but don’t think every click justifies the research cost.
Time on Site/Engagement
While reducing time on productivity tasks is a good thing, more time on a website can be a good thing. When you’re looking to convert browsers to buyers, increasing the time on site increases the opportunity for conversion. But in terms of this metric’s closeness to ROI though, you’re out near Neptune.
Number of Return Visitors/Return Visitors
Now you’re about as far out as Pluto from making an ROI case here. In the early 2000s, pageviews and unique visitors were all a company needed to show value and go public. Getting people’s attention and then getting them to return can translate into future leads and sales. If you have some way to turn people into profits, this might be a good ROI metric; otherwise, the link is tenuous at best.
Net Promoter Score
You’re now in the Kuiper belt of ROI. The popular Net Promoter Score is the best or second best predictor of future company revenue growth in 11 of 14 industries, which establishes some linkage to growth. While some of the research behind the lofty claims of the NPS have been called into question [pdf], it seems reasonable that more positive customer word-of-mouth will bring financial benefits for a company.
We’ve found that the many usability measures, including the SUS, correlate highly with the NPS. Improve the usability metrics and you have a loose connection to ROI. And because executives in many companies get bonuses based on improving the NPS, making your boss wealthier might not result in increased company revenue, but it sure may result in your career ROI!
Summary
Making a case for ROI is a good thing to help justify methods that should help the user and ultimately the organization’s bottom line. But don’t overstate or oversell your case. Understand the limits of your data. Both the metrics and methods affect the strength of your case for a return on investment. You need to have metrics that are closer to revenue and methods that can isolate your changes from other factors. While the 300 million dollar button and reduced support calls for Autodesk make compelling stories, neither were collected from a controlled experiment, so it’s harder to know how much revenue would have increased anyway and how much support calls would have fallen.
Even with a controlled experiment like an A/B test, if the changes in the alternate design are more than just UX changes, the case for associating a return on investment is weakened. For example, if both a new navigation layout is presented along with price changes, it will be hard to disentangle the contribution of price changes and navigation changes. Fortunately, you can conduct a more sophisticated experiment (called a Multivariate Test) that will control for multiple variables and make a more compelling case for ROI. But that’s a topic for another blog.


