
How Hard Are Your Surveys to Take?
Surveys are ubiquitous. We’re all inundated with requests to answer questions about what we think, what we do and what we might do. You’ve almost surely been asked to fill out surveys about: a hotel stay a car-repair a restaurant meal a flight a tech-support call Surveys are everywhere because they are such a cost-effective

Does Response Timing Matter in Online Research?
Online surveys are a critical tool used by many companies to make decisions about customers’ attitudes. While we may categorize customers according to the timing of their purchases–identifying them, for example, as “early adopters,” “first movers,” and “laggards,” should we also categorize survey respondents in a similar way? In other words, does how quickly a
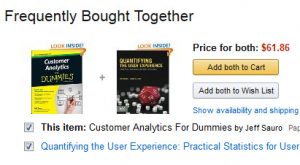
Customers Who Bought This Item Also Bought…Affinity Analysis Explained
You know the scenario. You’re browsing books on Amazon, and you scroll down to see the now-familiar phrase: “Customers Who Bought This Item Also Bought…” Amazon then presents you with a list of books that, in many cases, are of interest to you. Have you ever wondered how Amazon knows what books to recommend? The
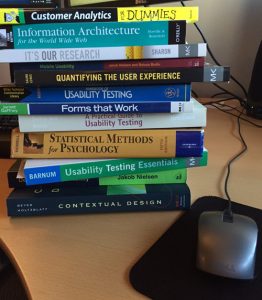
25 Rules & Recommendations for the UX Researcher
User research is not a hard science. But like all behavioral sciences, there are principles, best-practices, rules and recommendations. Across dozens of tutorials, five books, many articles and blogs, boot camps, and discussions with both seasoned and new UX professionals, I’ve noticed a number of common problems and themes related to measuring the customer experience.

How To Weight Data To Make More Balanced Decisions
Rarely is a customer population made up of a homogenous group of customers who share the same attributes. Consequently, our samples contain a mix of customers who may or may not reflect the composition of the customer population. There are a number of variables that affect how customers think and behave toward products and services.
Measuring Attitude Lift
Shift happens. Customer attitudes shift based on product, website, or any number of experiences. That shift can be for the better or worse: A great experience using a product to solve a problem An infuriating call to customer support An emotionally evocative advertisement A frustrating time locating information on a website One way to understand

Getting to Know Your Data Types
Know your data. When measuring the customer experience, one of the first things you need to understand is how to identify and categorize the data you come across. It’s one of the first things covered in our UX Boot Camp and it’s something I cover in Chapter 2 of Customer Analytics for Dummies. Early consideration

Are mobile websites truly less usable than desktop websites?
The typical mobile website experience is horrible. Everyone knows that, right? Sure, it’s easy to find some terrible mobile website experiences, but are mobile websites systematically worse that their desktop counterparts? Now that 80% of all adults who go online own a smartphone this is an important question to answer. Mobile websites often look like
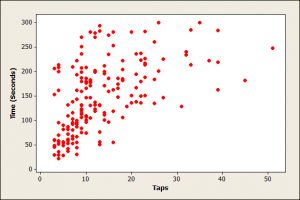
Predictive Customer Analytics 101: The Correlation
Want to know what customers are likely to do? You’re not alone. Most organizations would love to predict their customers’ next action or attitude. Unfortunately, there isn’t an analytics crystal ball that provides a clear and accurate picture of the future. Instead, we have to rely on the much murkier reality of past data to

6 Opposing UX Concepts that are Really Complementary
As you approach a research project, you are often faced with choices about different methods and concepts. While you consider your options among methods, it may be that opposing methods actually offer a complementary rather than contradictory view of the user experience. The following pairs of essential concepts are often portrayed as mutually exclusive while,

How Confident Do You Need to be in Your Research?
Every estimate we make from a sample of customer data contains error. Confidence intervals tell us how much faith we can have in our estimates. Confidence intervals quantify the most likely range for the unknown value we’re estimating. For example, if we observe 27 out of 30 users (90%) completing a task, we can be

The Top 10 UX Articles of 2014
It was another busy year on MeasuringU.com. In 2014, our articles were served up 2.5 million times to 988,000 visitors. Thank You! A lot of effort goes into researching and writing the articles we publish. We get a lot of our ideas with working directly on the problems we write about and feedback from readers.