
Do Click Tests Predict Clicks on Product Pages?
How predictive are click tests? Does the first click on an image really predict what would happen on a fully functioning website? In an earlier article, we reviewed the literature on click testing. We found that the primary—probably only—source that established the link between the first click and ultimate task success wasn’t done on images
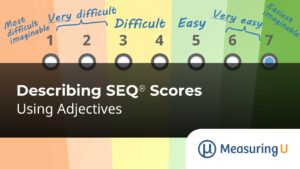
Describing SEQ® Scores with Adjectives
How hard is it to figure out the total cost of a mobile phone service plan? Have you had trouble finding the customer support number for your cable provider? How do you quantify these experiences? What words would you use to describe them? While we have ways of measuring perceived ease using numeric scales, rating

UX and NPS Benchmarks of Theme Park Websites (2023)
While life can feel like a metaphorical roller coaster, in some cases, there is a literal roller coaster. In 2021, over 100 million people ventured to a theme park in North America. For many of these visitors, the experience started well before the thrill of the ride, when they bought tickets and researched details about
Does Thinking Aloud Uncover More Usability Issues?
One of the most popular UX research methods is Think Aloud (TA) usability testing. In TA testing, participants speak their thoughts while attempting tasks. The process helps researchers identify usability problems and potential fixes. But is the process of thinking aloud necessary to uncover problems and insights? Earlier, we investigated the effects of TA on

When and Why to Use a Click Test
Where will people click on a webpage or app? It’s a good question because knowing where people click can help designers understand how functions and content help or inhibit users from accomplishing their tasks. Our earlier research has shown that the first click on images is reasonably predictive of the first click on live websites,
Measuring Tech Savviness with Technical Activity Checklists
UX research is geared primarily toward understanding how to improve the experience of products, websites, and software. The intent is not to assess people but to use people to assess product experiences. But people’s ability to solve technical problems—what we often loosely refer to as tech savviness—can confound our research findings. That is, including only
Is What You See What You Get?
Examining the Evaluator Effect in Unmoderated Usability Testing
If different researchers conduct a study, will they identify different problems? While it was originally controversial, the evaluator effect is now well-established in the field of UX research. The evaluator effect is the finding that, in general, different teams or individuals conducting a usability study will identify and report different problems (Hertzum & Jacobsen, 2003).

Can ChatGPT Replace UX Researchers?
An Empirical Analysis of Comment Classifications
ChatGPT. A sequence of letters that didn’t mean much to people a few months ago is now ubiquitous. It seems like every social media post mentions ChatGPT (especially the latest version, 4) and hypes it as a game changer. It’s been used to quickly summarize text, do homework, pass the bar exam, and code the game Duck Hunt

UX and NPS Benchmarks of Office Supply Websites (2023)
When people need office supplies, they’re unlikely to use Dunder Mifflin; instead, they’ll search online. But like the fictional paper supply company, many well-known office-supply brands (some with physical stores) have struggled to compete with Amazon and haven’t recovered from the impacts of COVID policies on in-person work. In 2019, Office Depot closed 50 stores,
Sample Sizes for Rating Scale Confidence Intervals
Sample size computations can seem like an art. Some assumptions are involved when computing sample sizes, but it should be more math than magic. A key ingredient needed to cook up a sample size estimate is the standard deviation. You need yeast to make bread, and you need a measure of variability to make an

Initial Validation of Tech-Savvy Measures
How do you measure tech savviness? For several years (since 2015), we’ve been on a mission to develop a valid and practical measure. In our earlier articles, we have Reviewed the literature. We reviewed the literature on tech-savvy measures and found three key approaches to measuring tech-savviness by assessing (1) what a person knows, (2)
How to Estimate the Standard Deviation for Rating Scales
The standard deviation is the most common measure of variability. It’s less intuitive than measures of central tendency such as the mean, but it plays an essential role in analysis and sample size planning. The standard deviation is a key ingredient when building a confidence interval and can be easily computed from a sample of