Does Coloring Response Categories Affect Responses?

Survey response options come in all sorts of shapes, sizes, and now, colors. The number of points, the addition of labels, the use of numbers, and the use of positive or negative tone are all factors that can be manipulated. These changes can also affect responses, sometimes modestly, sometimes a lot. There is some concern

Read More »

10 Things to Know about the Microsoft NSAT Score

We love writing about measures at MeasuringU. We write about measures we’ve created (SUPR-Q®), industry standards (SUS, NPS, and TAM), emerging industry standards (UMUX-Lite), and lesser-known ones (lostness). Jim Lewis and I also have a chapter dedicated to questionnaires in Quantifying the User Experience. We’ll often encounter a new measure when working with clients, as

Read More »

Picking the Right Dependent Variables for UX Research

What gets measured gets managed. It’s more than a truism for business executives. It’s also essential for the user experience professional. In business, and UX research in particular, you don’t want to bring focus to the wrong or flawed measure. It can lead to wrong decisions and a misalignment of effort. In an earlier article,

Read More »

Understanding Variables in UX Research

UX research pulls many terms, methods, and conventions from other fields. Selecting a method is an important first choice in measuring the user experience. But an important next step is understanding the variables you’ll have to deal with when designing a study or drawing conclusions. Variables are things that change. Variables can be controlled and measured.

Read More »

Should You Love the HEART Framework?

UX has no shortage of models, methods, frameworks, or even catchy acronyms. SUS, TAM, ISO 9241, and SUPR-Q to name a few. A relatively new addition is the HEART framework, derived by a team of researchers at Google. And when Google does something, others often follow. HEART (Happiness, Engagement, Adoption, Retention, and Task Success) is

Read More »

How Accurate Is Self-Reported Purchase Data?

How much did you spend on Amazon last week? If you had to provide receipts or proof of purchases, how accurate do you think your estimate would be? In an earlier article we reported on the first wave of findings for a UX longitudinal study. We found that attitudes toward the website user experience tended

Read More »
Dependent variables

What Is the Purpose of UX Measurement?

We talk a lot about measurement at MeasuringU (hence our name). But what’s the point in collecting UX metrics? What do you do with study metrics such as the SUS, NPS, or SUPR-Q? Or task-level metrics such as completion rates and time? To understand the purpose of UX measurement we need to understand fundamentally the

Read More »

What Is the CE11 (And Is It Better than the NPS)?

For measuring the user experience, I recommend using a mix of task-based and study-level measures that capture both attitudes (e.g. SUS, SUPR-Q, SEQ, and NPS) and actions (e.g. completion rates and times). The NPS is commonly collected by organizations and therefore UX organizations (often because they are told to). Its popularity inevitably has brought skepticism.

Read More »

How to Assess the Quality of a Measure

It seems like each year introduces a new measure or questionnaire. Like a late-night infomercial, some are even touted as the next BIG thing, like the NPS was. New questionnaires and measures are a natural part of the evolution of measurement (especially measuring difficult things such as human attitudes). It’s a good thing. I’ll often

Read More »

The One Number You Need to Grow (A Replication)

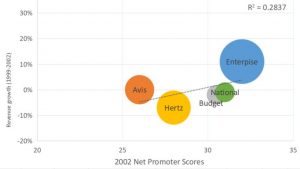
The one number you need to grow. That was the title of the 2003 HBR article by Fred Reichheld that introduced the Net Promoter Score as a way to measure customer loyalty. It’s a strong claim that a single attitudinal item can portend company success. And strong claims need strong evidence (or at least corroborating

Read More »
0
    0
    Your Cart
    Your cart is emptyReturn to Shop
    Scroll to Top