Sample Sizes for Comparing Rating Scales to a Benchmark
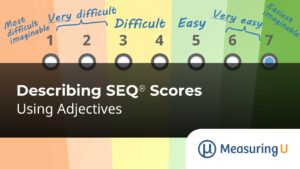
Is product satisfaction above average? Is it best in class? Do customers have a favorable or unfavorable opinion of the current product? When UX researchers want to measure attitudes and intentions, they often ask respondents to complete multipoint items like the one shown in Figure 1. It’s also common to set a target benchmark for