Adding confidence intervals to completion rates in usability tests will temper both excessive skepticism and overstated usability findings. Confidence intervals make testing more efficient by quickly revealing unusable tasks with very small samples. Examples are detailed and downloadable calculators are available.
You just finished a usability test. You had 5 participants attempt a task in a new version of your software. All 5 out of 5 participants completed the task. You rush excitedly to tell your manager the results so you can communicate this success to the development team. Your manager asks, “OK, this is great with 5 users, but what are the chances that 50 or 1000 will have a 100% completion rate?” You stop, think for a minute and say “pretty good.”
Fortunately there is a way to be a bit more precise than “pretty good” and you don’t need to be a statistician (or bribe the one in your company with jelly-donuts to help you). The way to precision is through confidence intervals. Not only are they precise, but they make you sound smart when you talk about them. This article has two parts. In part one confidence intervals for task completion will be discussed and in part two (coming soon) confidence intervals for task times will be illustrated.
Need a CI refresher? Try the adaptive confidence interval lessons.
Part 1: Confidence Intervals for Task Completion
Even if the only metric you’re gathering during a usability test is a binary assessment of task completion (complete, didn’t complete) you can and should still provide a confidence interval. Here’s why. If five out of five users complete a task, you can be 95% confident that the completion rate could be as high as 100% but it also could be as low as 48%. In other words, if you tested another five users, their completion rate will fall somewhere between 48% and 100%. Or if you’re testing 100 users, as many as 52 of the 100 could fail the task. Calculation Note(added 8/13/2008)
Most analysts would agree that a 48% completion rate is unacceptable. What is often overlooked is the as unacceptable degree of uncertainty. The question every analyst must also ask is, “How much risk are we willing to accept?” That risk is described in two places:
- The confidence level
- The width of the confidence interval
Both are easy to calculate and present along with the completion rate. Here’s how.
Step 1: Determine your Confidence Level
Quite simply, the confidence level represents the likelihood that another sample will provide the same results. It is the percent likelihood statement that accompanies the width of the confidence interval. It is set often to the 95% level by convention but can be adjusted. You would want to lower it to 90% or 85% or raise it to 99% depending on the impact of being wrong. A confidence level of 99% means that 1 out of 100 times your sample completion rate will NOT fall within your confidence intervals. We will set it to 95% for these examples.
Step 2: Calculate the Confidence Interval
Example 1: 50% Completion Rate (Symmetric Confidence Intervals)
To create the confidence intervals for task completion we use the binomial distribution, since the event is binary/binomial. To start with a simple example lets assume you tested 40 users attempting to complete one task. Half of them completed the task and half failed, making the completion rate 50%.
First we calculate the standard error of the mean. Since we’re sampling to determine the real mean, the standard error is as the name suggests, the estimate of the error between the true mean of the population and our sample mean. Think of the standard error as the standard deviation of the mean—or the area where the sample mean can “float” as we take multiple samples. The bigger the standard deviation, the bigger the error. The standard error is calculated by dividing the standard deviation by the square root of the sample size. To obtain the standard deviation we multiply the proportion of people who completed the task (p) times the proportion of people who failed the task (1-p or q).
(.5)×(.5) = .25
This value is the variance of the sample. The variance is the standard deviation squared, so to obtain the standard deviation we take the square root of .25 which is .50. Then divide that figure by the square root of the sample—in this case 40. The square root of 40 is 6.325.
| StDev. | SQRT Sample Size | |||
| Standard Error = | .50 | ÷ | 6.325 | = .0791 |
Now that you have the standard error, you need to multiply this value times a critical value from the t-distribution. This value is derived from the confidence level set above (.05) and the sample size minus one, 39 (called degrees of freedom).
To get this critical value you can either look the value up in a t-distribution table or use the excel function [=TINV(.05, 39)]. This will return (2.023) which is the critical value for a 95% confidence level with (40-1) degrees of freedom.
And finally, the confidence interval is the standard error times the critical value.
| Stnd Err | t-value | |||
| Confidence Interval = | .0791 | × | 2.023 | = 16% |
So we can say with 95% confidence that the sample proportion of 50% could be as low as 34% (p – CI) or as high as 66% (p +CI). If you were to continue sampling users to complete a task, 95 times out of 100, the proportion will fall somewhere between 34% and 66%.
That’s the basic concept behind calculating the confidence interval. The one unfortunate wrinkle in this neat calculation is that the confidence interval is NOT usually symmetric. That is, it’s not always a neat + or – one number (16% in the example). As the proportion successful or unsuccessful gets closer to 100% complete or 0% complete, the binomial confidence interval departs from symmetry. Try it for yourself. What if 38 out of 40 users completed a task (p =.95). Using the formula above would provide a confidence interval of 7%.
Standard Error = SQRT[(.95)×(.05)]÷ SQRT(40) = .0344
t-statistic = (.05, 39) =
Confidence Interval = .0344× 2.023 =.0697
You can see immediately something’s awry as it doesn’t make sense to say that that we are 95% confident the true mean lies between 88% and 102% since there is no way to have more users complete a task than attempt it. The larger issue is that in binomial distributions the confidence interval is only symmetric when p is .5 or very close to .5. More often, the proportion is far from .5 and TWO confidence intervals need to be derived—one for above the proportion and one below the proportion. If this sounds confusing, don’t worry, it is and so is the calculation to derive them.
Example 2: 95% Completion Rate (Asymmetric Confidence Intervals)
There are at least two ways I’ve found to derive these asymmetric binomial confidence intervals. The first method is using a technique called the Paulson-Takeuchi approximation and the second uses the incomplete beta function and the F distribution. Don’t worry if you’ve never heard of either one of them, unless you’re a total stats geek, you shouldn’t have. The important point is that either one of these methods provides accurate asymmetric confidence intervals. Even better, there are calculators on the web that will do the work for you and I’ve also built an Excel spreadsheet you can download where all you have to do is plug in the values but can still see the workings of the formula. I used the incomplete beta function approach since there is a paper publicly available that shows the formulas.
Try this confidence interval calculator, or if you have Minitab you can get the confidence intervals from Stats > Basic Statistics > 1 Proportion.
Download Excel Binomial Confidence Interval Calculator
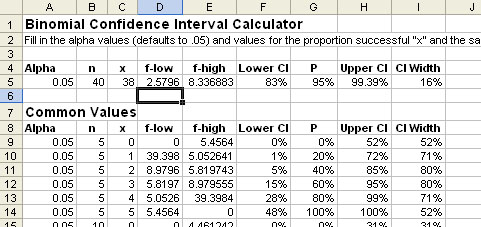
Figure1: Binomial Confidence Interval Calculator
Using either the Web, Minitab or the Excel calculator, take that same 95% completion rate and obtain the confidence intervals for the 38 out of 40 task (use .05 for the alpha error). You should get the lower interval as 83% and upper interval should be 99.4%. Compare that with the 88% and 102% intervals calculated earlier.
Using Asymmetric Confidence Intervals: A real example
All these calculations are nifty, but you may have a hard time being convinced that a 100% completion rate with five users could turn into a 48% completion with 1000 users (something the 95% confidence interval indicates is probable.) Here are the completion rates from of a summative usability evaluation on a task from a financial application.
After testing five users we had a 100% completion rate. We know the lower bounds of the interval could be 48% and continue testing to see what happens.
| 5 Users | |
| Lower CI | 48% |
| p | 100% |
| Upper CI | 100% |
| CI Width | 52% points |
After 10 users the completion rate decreases to 80% and the lower CI is 44%. Notice how the width of the confidence interval actually got slightly wider.
| 10 Users | |
| Lower CI | 44% |
| p | 80% |
| Upper CI | 97% |
| CI Width | 53% points |
We continued testing and below are the results of testing 45 users. Notice how the confidence interval begins to narrow and the mean begins to stabilize as we test more users.

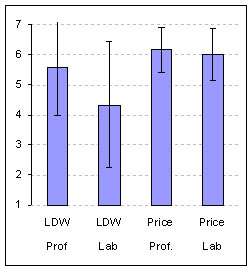
Figure 2: Proportions from completion rates and 95% Binomial Confidence Intervals
Most usability testing, even summative benchmark testing, doesn’t usually have a sample as large as 45 users. Even with a larger than normal sample, the width of the confidence interval is still rather large. What becomes immediately evident is that it is much easier to proclaim a task completion rate unacceptable than it is to declare it acceptable. That is, it’s hard to show usability, it’s much easier to show un-usability. This is a point Jim Lewis made in his 1996 article on Binomial Confidence intervals and it’s worth repeating—
[Binomial Confidence Intervals] cannot be used with a small sample to prove that a success rate is acceptably high. With small samples, even if the observed defect percentage is 0 or close to 0 percent, the interval will be wide, so it will include defect percentages that are unacceptable. Therefore, it is relatively easy to prove (requires a small sample) that a product is unacceptable, but it is difficult to prove (requires a large sample) that a product is acceptable (Lewis p.735).
What Confidence can do for you
Here’s what you should take away from this article. First, binomial confidence intervals are a resource saving tool during formative evaluations. When refining a new feature that needs a high completion rate, say 90% for first time users, you’ll know when to reject a design earlier. If only two out of five users complete the task, there’s less than a 5% chance that the completion rate will ever be above 85%.
Second, it should temper both overconfidence and excessive skepticism in usability findings. It will show you and the readers of usability reports the true sense of confidence in a completion rate. Instead of leaving the door wide open for attacks on sample size issues, the door now is partially closed (it’s only open as wide as your confidence intervals). Instead of arguing about undefined possibilities, you can discuss probabilities. If the lower limits of the confidence interval are too low, then you can either sample more users or know the unacceptable completion rate is indicative of a problem that needs to be addressed.
Calculation Note: When the observed completion rate is 100% or 0% there cannot be a two sided confidence interval (since you cannot have more than 100% or less than 0%). In these cases it is necessary to use a z-critical value for a one-sided confidence interval. For example, a 95% two sided confidence interval uses the z-score of approximately 1.96, a one sided interval uses a z-score of approximately 1.64. It is often the case that statistics text or examples you encounter do not make this adjustment for simplicity in instruction. The 5/5 users completing a task example in this article would then have an interval of between 55% and 100%. The Confidence Interval Calculator will make this adjustment automatically.
- Fujino, Y. (1980). Approximate binomial confidence limits. Biometrika, vol. 67, 677-681.
- Harte, David, “Non Asymptotic Binomial Confidence Intervals” from the Statistics Research Associates (1992). Publication downloaded June 2004
- Lewis, James “Binomial Confidence Intervals for Small Sample Usability Studies” in Proceedings of the 1st International Conference on Applied Ergonomics. Istanbul, Turkey, May (1996)
- Landauer, Thomas K, “Research Methods in Human-Computer Interaction” in The Handbook of Human Computer Interaction M. Helander (1998)


