 One of the most popular UX research methods is Think Aloud (TA) usability testing.
Having participants speak their thoughts while working on tasks helps researchers identify usability problems and potential fixes.
After a TA session, many UX research teams also collect study-level metrics. Study-level metrics are typically asked only once in a study (unlike task-level metrics, which are collected after each task).
Study-level metrics allow users to reflect upon an experience more broadly than task-level metrics. They often include a mix of overall satisfaction, perceived usability (e.g., SUS, SUPR-Q®), perceived ease and usefulness (e.g., UX-Lite®), and behavioral intentions (e.g., likelihood to purchase, likelihood to recommend [NPS]). But does the act of speaking while attempting a task affect these study-level metrics?
In an earlier analysis, we found that thinking aloud had a modest negative impact on task-level metrics, with roughly 5% lower ease (SEQ) and confidence scores than those who didn’t think aloud. The impact on task times was more notable. On average it took participants about 20% longer to complete tasks when thinking aloud in an unmoderated study compared to groups who completed tasks silently.
We also reviewed five published studies that compared silent usability testing with moderated TA, finding mixed results on the impact on metrics. Generally, these studies found no differences in subjective ratings, but not always. While there were no differences reported in ease ratings (two studies) and satisfaction ratings (one study), one study reported higher NASA TLX workload ratings for participants who were thinking aloud.
In this article, we’ll review the same dataset of ten studies used in the task metrics and task-time analysis and examine the impact, if any, on UX metrics at the study level (SUPR-Q, NPS, UX-Lite).
Analysis of TA on Study Metrics from Ten Studies
Between January and September 2022, we conducted ten studies with participants from an online U.S.-based panel using the MUIQ® platform. In each study, participants were randomly assigned to a TA or non-TA condition. In both conditions, participants were asked to attempt one task on a website (e.g., United.com, Zillow.com). The websites were in the travel, real estate, and restaurant industries.
We have covered details about several of these studies (including descriptions of several of the tasks) in our earlier article on TA-related drop-out rates. Each of these ten studies had between 40 and 60 unique participants. During our screening and recruiting process, we ensured participants couldn’t take a study more than once and ensured participants in the TA condition actually thought aloud by reviewing the videos. The data preparation details are available in the article on TA task time analysis.
After completing these data quality steps across the ten studies, we had a final sample size of 423 participants: 221 in the TA condition and 202 in the non-TA condition.
SUPR-Q
The SUPR-Q is an eight-item measure of the quality of the website user experience. It has four subscales of usability, appearance, trust, and loyalty. We’ll first examine the overall SUPR-Q means and then revisit the subscales after examining LTR and UX.
Table 1 shows that in seven of the ten studies, participants in the TA condition had slightly higher SUPR-Q mean scores compared to the non-TA condition (none was statistically significant). However, of the three that had SUPR-Q scores higher in the TA condition, one study (United 1) was 13% higher for the TA condition and statistically significant (p = .048). Aggregated across the studies, the differences were only modestly different at 2% higher SUPR-Q mean scores for the non-TA condition.
| Study | Diff | |||
|---|---|---|---|---|
| United 1* | −0.5 | |||
| United 2 | 0.2 | |||
| United 3 | 0.0 | |||
| Tripadvisor 1 | 0.4 | |||
| Tripadvisor 2 | 0.3 | |||
| Tripadvisor 3 | 0.3 | |||
| Kayak | 0.3 | |||
| Zillow | 0.0 | |||
| OpenTable | −0.1 | |||
| Hilton | 0.1 | |||
| Average | 0.1 |
Table 1: SUPR-Q means in the TA and non-TA conditions. Studies with a * indicate statistical significance at p < .10. Sample sizes vary between 12 to 24 per condition.
Correlations Between Study-Level Metrics
The SUPR-Q’s subfactors of usability, appearance, trust, and loyalty are correlated (see the original validation study in the Journal of User Experience for more discussion). Given our earlier validation of the UX-Lite, we also expect the subscales to correlate highly with the useful and usable factors of the UX-Lite and the raw Likelihood-to-Recommend item (because it is one of the two items in the loyalty factor). Table 2 shows the correlation matrix between all the post-study metrics collected in this study at the participant level.
It includes all four subscales from the SUPR-Q, the Ease and Useful items of the UX-Lite, and the Likelihood to Recommend item used to compute the Net Promoter Score.
| Usability | Credibility | Loyalty | Appearance | Ease | Useful | |
|---|---|---|---|---|---|---|
| Credibility | 0.50 | |||||
| Loyalty | 0.60 | 0.54 | ||||
| Appearance | 0.71 | 0.51 | 0.63 | |||
| Ease | 0.96 | 0.48 | 0.58 | 0.69 | ||
| Useful | 0.70 | 0.55 | 0.59 | 0.61 | 0.67 | |
| LTR | 0.60 | 0.50 | 0.93 | 0.64 | 0.57 | 0.57 |
Table 2: Correlations (at the participant level) between subscales of the SUPR-Q, the Ease and Useful items of the UX-Lite, and the Likelihood-to-Recommend item used to compute the Net Promoter Score. All correlations are statistically significant (p < .01).
All correlations are large, so we’d expect similar (although not identical) findings when comparing these metrics in the TA vs. non-TA conditions as we did with the overall SUPR-Q means. We’d also expect the strength of these correlations to increase if we correlated at the study level.
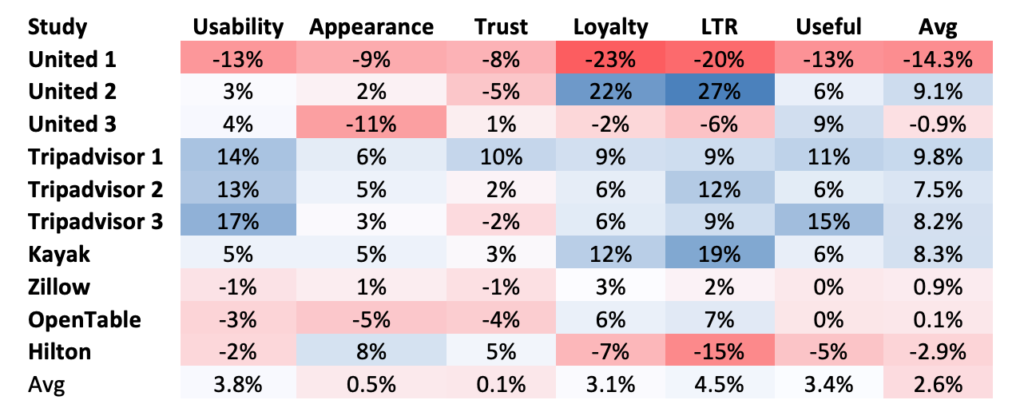
Table 3 shows the differences of the non-TA means minus TA means for the respective constructs: the four from the SUPR-Q, the Likelihood-to-Recommend item (LTR), and the useful and usable factors of the UX-Lite along with averages across studies and constructs. Similar to the findings from the SUPR-Q differences in Table 1, the United 1 study had the largest difference across constructs, showing that the TA condition scored more favorably than the non-TA condition. However, this was a notable exception, as eight of the other studies showed the opposite, with non-TA ratings scoring more favorably.
Table 3: Differences are non-TA means minus TA means (converted to percentages) for the four SUPR-Q subscales, the Likelihood-to-Recommend item (LTR), and the useful factor of the UX-Lite, along with averages across studies and constructs. Colors in cells correspond to magnitudes, with dark blue for the largest positive value and dark red for the largest negative value.
After averaging across the ten studies, Table 3 also shows that the differences in study-level metrics were small to nonexistent. This suggests that study-level metrics, unlike task-level metrics, are less impacted by the immediate task experience, including the influences of thinking aloud (such as taking longer to complete). The average difference overall was just 2.6%, from less than 1% for two metrics (appearance and trust) to a high of 4.5% for the likelihood-to-recommend. Positive percentage differences mean the non-TA condition was rated more favorably. This suggests the impact of thinking aloud, if any, is a very slight reduction of study-level metrics.
Summary and Takeaways
We analyzed the results of ten remote unmoderated usability studies with 423 participants (roughly half in a TA condition and half in a non-TA condition) to investigate one question: does thinking aloud affect study metrics? We found
Thinking aloud had little impact on post-study attitudinal metrics. Across six-post study metrics, we found that the effect of thinking aloud had little impact. When it does, it tends to lower metrics only very slightly.
Results across metrics were comparable. Study-level metrics tend to correlate, and they showed a strong correlation here with most metrics (most correlations were r > .5). With the strong correlation, we found similar results regardless of the metrics—the impact of thinking aloud had no statistically significant impact.
Study context matters. Similar to our task-level analysis, we did not see a consistent effect across all studies. Most studies showed lower scores when participants were thinking aloud, but in one study, those thinking aloud actually rated the experiences as significantly better. This could be evidence of other confounding factors that affected study-level metrics (e.g., task type, complexity) or could simply be due to chance (e.g., alpha inflation), making this a topic for future research.
Study Limitations
We repeated studies of tasks and websites. Although we had ten separate studies and unique participants in each study, several of the studies used the same website and the same or similar task. We did this intentionally to see whether the results we obtained with one sample were repeatable, but the similarities might have attenuated the magnitude of observed differences relative to what would happen with a more independent set of studies.
We conducted remote unmoderated studies only. We did this to fill an obvious gap in the research literature, but we cannot necessarily generalize these findings to moderated studies where there can be complex verbal interactions between moderators and participants.


