 How do you measure tech savviness?
For several years (since 2015), we’ve been on a mission to develop a valid and practical measure.
In our earlier articles, we have
- Reviewed the literature. We reviewed the literature on tech-savvy measures and found three key approaches to measuring tech-savviness by assessing (1) what a person knows, (2) what a person does (or reports being able to do), and (3) what a person feels (attitudes, especially tech-savvy self-assessments).
- Generated and tested candidate items. To explore these three approaches, we conducted a pilot study with 271 respondents who took a seven-item technology quiz (what a person knows), completed a thirteen-item activity checklist (what a person does), and rated their level of tech savviness on a single five-point scale (what a person feels). The results of this study indicated that quizzing was the least promising approach due to insensitivity (restricted range) and some difficulty with item development and maintenance. The single self-assessment item showed some promise but also had some sensitivity issues. The activity checklist was the most promising approach due to its robust range and correlation with self-assessed tech-savviness levels.
- Refined the items. In a follow-up study focused on refining the candidate measures of tech-savviness, 160 participants took a three-item technology quiz (the best items from the original set of seven items), completed an eight-item activity checklist (the least redundant subset of the original thirteen activities), and a nine-item battery of tech-savvy self-assessment ratings (the original plus eight new items). Quizzing continued to be the least promising approach, while the activity checklist continued to show the most promise. Adding additional items to the tech-savvy self-assessment method improved its sensitivity, but there were some issues with item redundancy and range restriction.
In this article, we describe the results of the next logical step in this research program—validating the candidate methods by associating them with the performance of a technical task. After all, the ultimate test of the effectiveness of a tech-savvy metric is that it should be predictive of successful task completion.
In-Person Tech-Savvy Study
Can you see tech savviness in action? Well, we wanted to find out by observing behaviors in an in-person study to see how well the two most promising methods from our previous research—tech-savvy self-assessment items and the activity checklist—are predictive of successful technical task performance.
In February 2018, we recruited a general mix of 50 participants in the Denver metro area and asked them to attempt a multi-step technical task.
Prior to coming into our labs, participants answered several items about their experience with technology including an eight-item tech-savvy self-assessment questionnaire (attitudes) and an eight-item activity checklist (actions). The questionnaire included the eight agreement items from the refinement study. The checklist retained five items from the refinement study, and we replaced the two programming activities (HTML and Java) and network troubleshooting activity with three TV-related activities (connecting a game console/Blu-ray player, connecting a streaming device, and connecting a cable/satellite box) to have a better match of activities to the planned task. The following lists show the wording of each item plus a short code for reference.
Attitude Items (1 to 5 Agreement Scale)
- I feel very confident when learning new technology. [Confident]
- I’m able to solve most technical problems I encounter. [SolveProbs]
- I rarely need technical assistance. [NoTechSupport]
- I enjoy learning how to use new products and software. [EnjoyLearning]
- People often ask me for help when troubleshooting technical problems. [AskMeHelp]
- I’m usually the first of my friends and family to try a new type of technology. [FirstTryTech]
- I’m never intimidated by technology. [NotIntim]
- I am “tech-savvy.” [TechSavvy]
Activity Checklist (Select All That Apply)
- Connecting a game console or Blu-ray player to a TV. [GameConsole]
- Installing a printer on your computer. [InstallPrinter]
- Setting up a wireless router. [Router]
- Connecting a streaming device to a TV. [Streaming]
- Installing a new app on your phone. [NewApp]
- Using Excel formulas. [Excel]
- Connecting a cable or satellite box to a TV. [CableBox]
- Detecting and removing a virus from your computer. [Virus]
Procedure
The procedure followed a standard moderated (researcher present) think-aloud study with one technology task. We focused on the participant’s performance rather than the software and hardware functionality (we did not tell this to participants). Participants had up to ten minutes to complete the task (and a little bit more if they were close to task completion; otherwise, they were stopped). This was the task description:
Let’s imagine you want to show your friend your favorite music video on youtube.com. Given the items in front of you, connect the computer to the TV and bring up YouTube on the TV. Please use the computer, either Mac or PC, that you are most familiar with.
Participants were given the following items:
- A laptop (Mac or PC based on their screener)
- A TV/Monitor
- An HDMI cable
- An internet cable (distractor cable)
The task success criterion was for the participant to mirror a YouTube video to an auxiliary monitor from a laptop after connecting it via an HDMI cable (Figure 1).
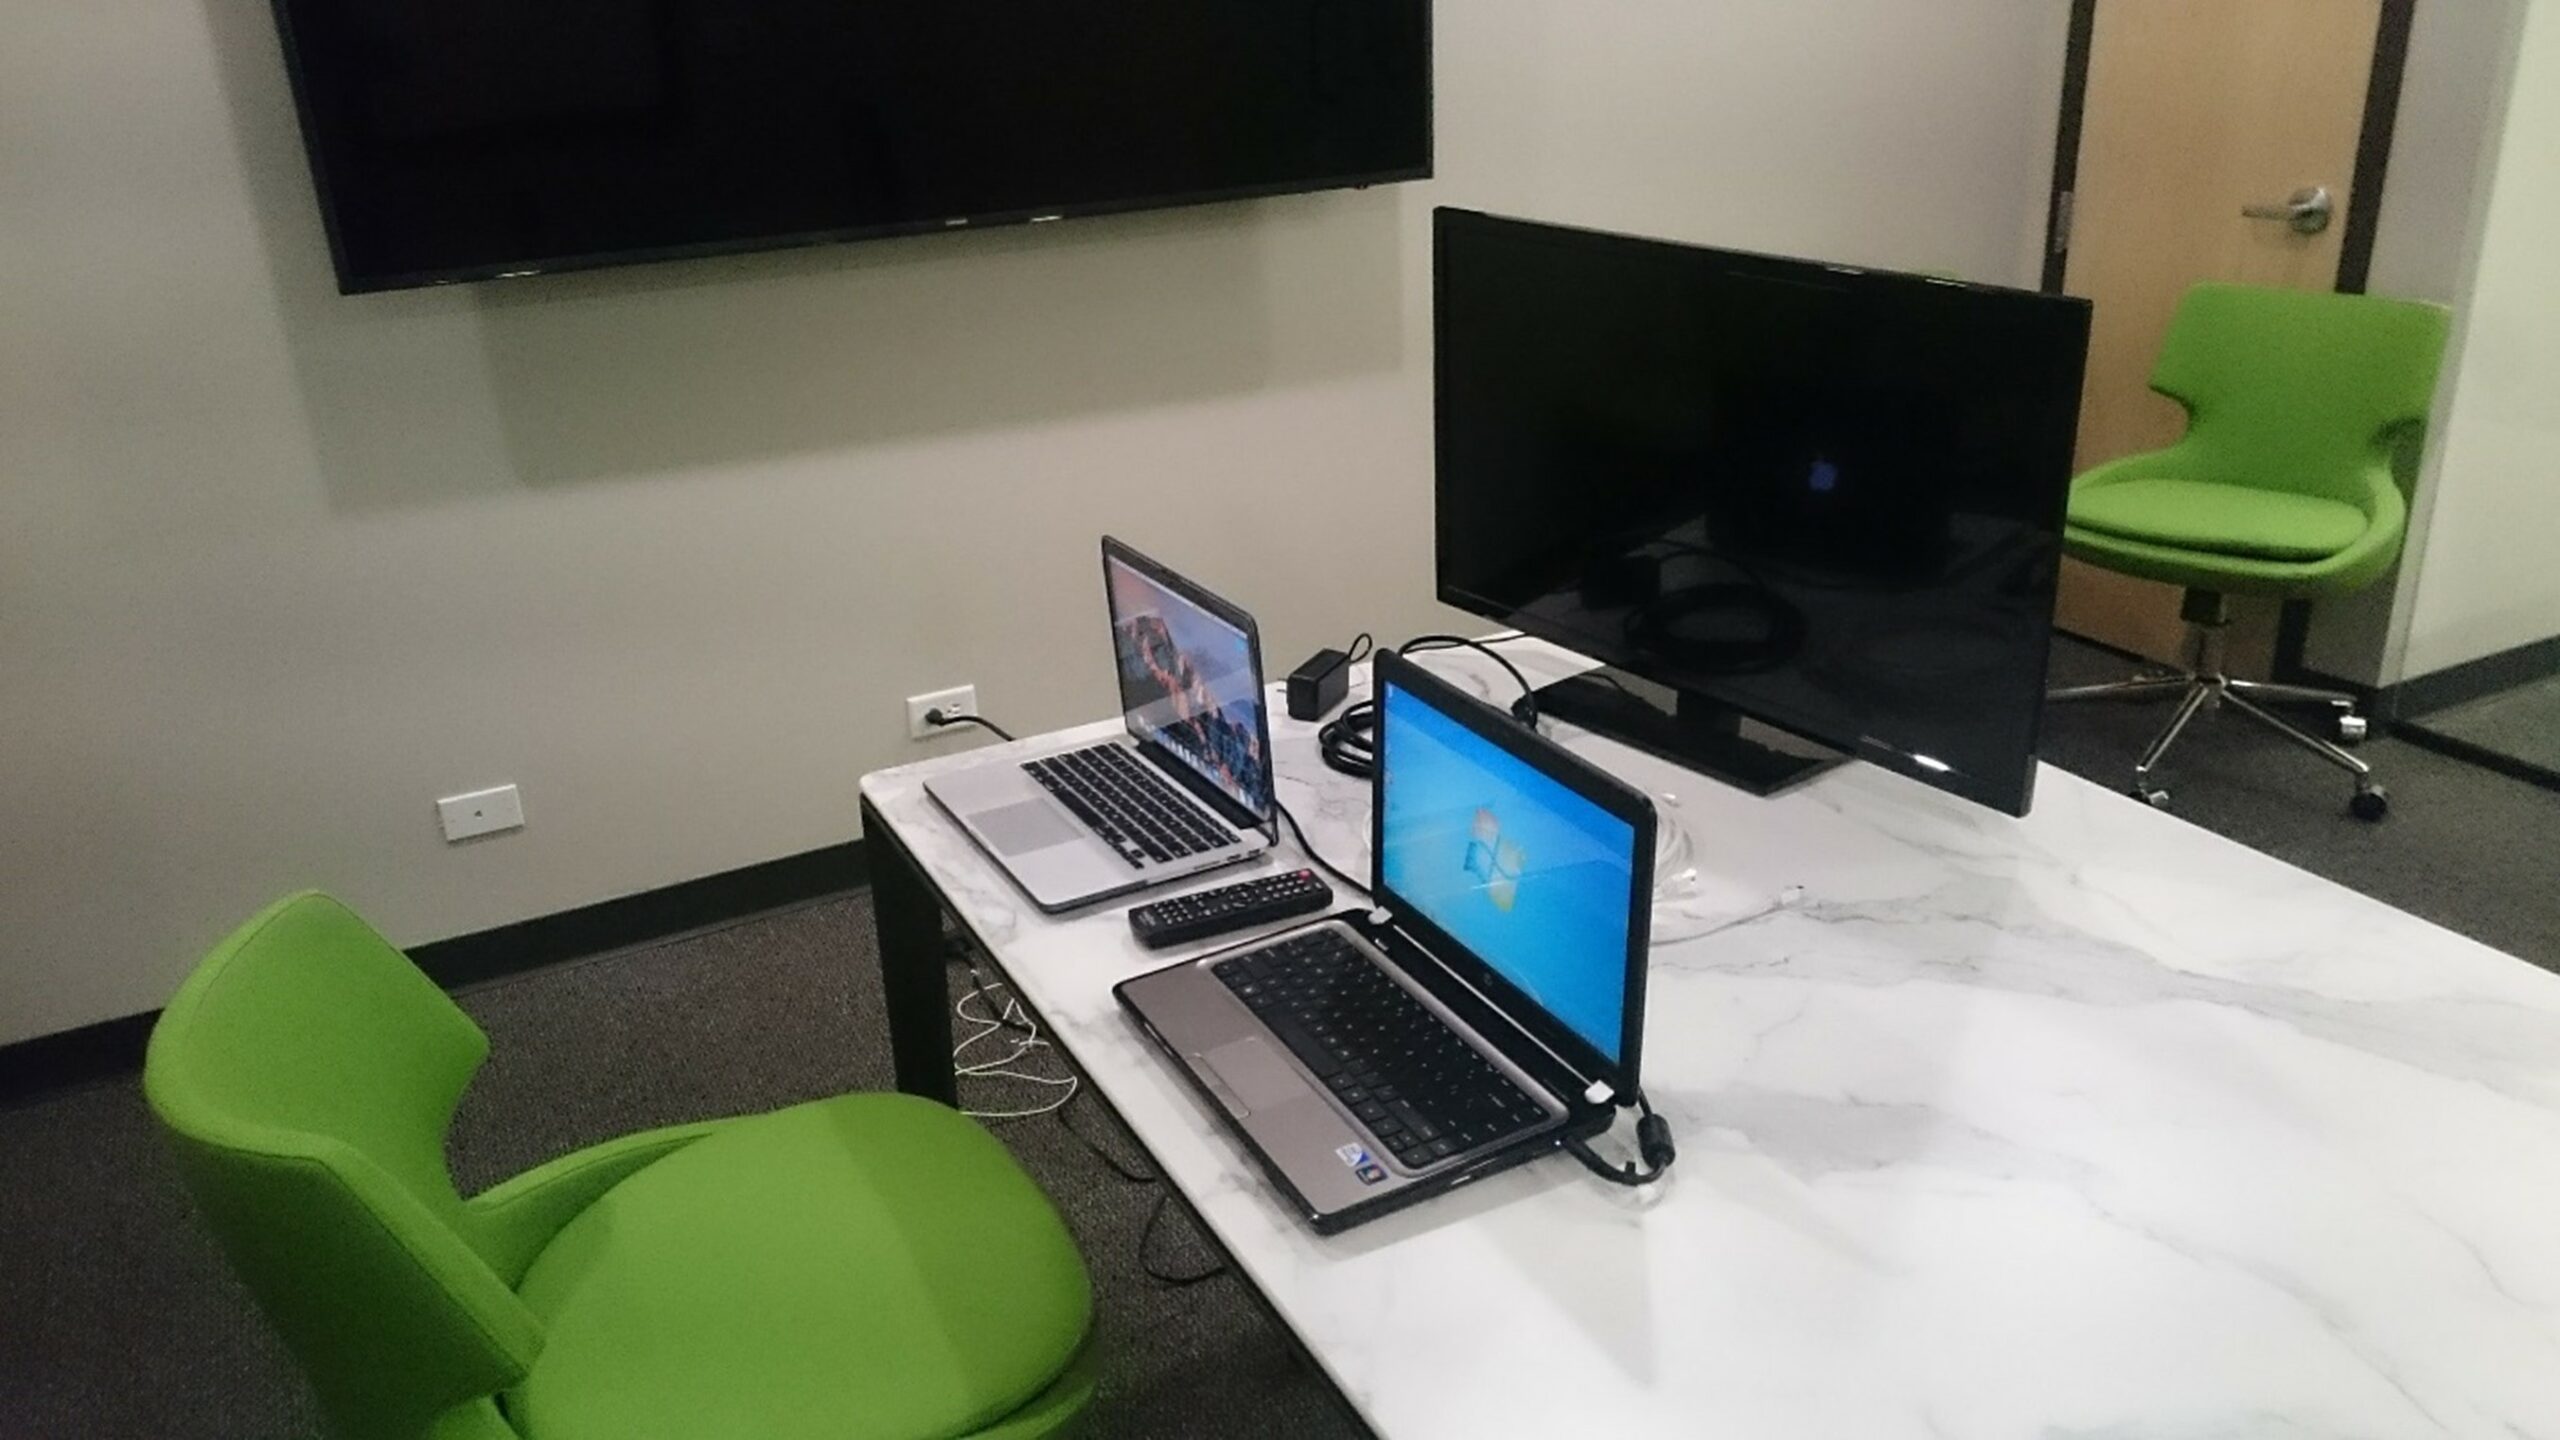
Overall task success was based on the completion of three main steps. After attempting the task, participants used the SEQ® and a seven-point confidence item to rate their ease and confidence toward the hardware portion (connecting the HDMI cable and turning on the TV) and software portion of the study.
Participants
Of the 50 people invited to participate in this study, three were no-shows and one participant didn’t complete the screener, leaving a sample size of 46 (30 women and 16 men). We intentionally recruited a range of ages (Table 1).
| Age | Count | % |
|---|---|---|
| <25 | 9 | 20% |
| 25–39 | 15 | 33% |
| 40–49 | 11 | 24% |
| 50–59 | 6 | 13% |
| 60+ | 5 | 11% |
Table 1: Distribution of participants’ ages.
Participants also had a mix of education (Table 2) and income (Table 3), with most having a college degree and making over $45k per year (2018 dollars).
| Education | Count | % |
|---|---|---|
| GED/High School | 5 | 11% |
| Some College | 11 | 24% |
| Bachelors | 24 | 52% |
| Graduate/Professional Degree | 6 | 13% |
Table 2: Distribution of participants’ education levels.
| Income | Count | Percent |
|---|---|---|
| 0–$24k | 6 | 13% |
| $25k–$44k | 6 | 13% |
| $45k–$71k | 21 | 46% |
| $72k–$99k | 9 | 20% |
| $100k+ | 4 | 9% |
Table 3: Distribution of participants’ incomes.
The self-reported use of PC/Mac was split roughly even, with slightly more using a PC (57%) than a Mac (43%).
Results
Tech-Savvy Metrics
Table 4 shows the means and standard deviations for the eight self-assessment attitudinal items collected in the screener of this validation study compared to results from the previous refinement study. The validation study means ranged from a low of 3.7 for the FirstTryTech item to a high of 4.5 for the Confident item, a range of just 0.8. The mean of the items in this validation study was 4.0, slightly larger than the mean of 3.8 from the refinement study, but not a statistically or practically significant difference—these are remarkably stable item means and standard deviations across the studies.
| Label | Validation Study Mean | Refinement Study Mean | Validation Study SD | Refinement Study SD | |
|---|---|---|---|---|---|
| FirstTryTech | I'm usually the first of my friends and family to try a new type of technology. | 3.7 | 3.4 | 1.2 | 1.1 |
| NotIntim | I'm never intimidated by technology. | 3.8 | 3.9 | 1.1 | 1.1 |
| AskMeHelp | People often ask me for help when troubleshooting technical problems. | 3.9 | 3.5 | 1.1 | 1.1 |
| NoTechSupport | I rarely need technical assistance. | 4.0 | 3.8 | 0.9 | 1.0 |
| TechSavvy | I am "tech-savvy." | 4.0 | 3.9 | 1.0 | 0.9 |
| SolveProbs | I’m able to solve most technical problems I encounter. | 4.1 | 3.9 | 0.8 | 0.9 |
| EnjoyLearning | I enjoy learning how to use new products and software. | 4.3 | 4.1 | 0.9 | 0.8 |
| Confident | I feel very confident when learning new technology. | 4.5 | 4.1 | 0.6 | 0.8 |
Table 4: Means and standard deviations of tech-savvy self-assessment items.
Table 5 shows the percentage of participants who selected each of the eight technical activities used in this validation study compared to data from the prior pilot and refinement studies.
| Label | |||
|---|---|---|---|
| NewApp | |||
| Excel | |||
| HTML | |||
| Java | |||
| Network | |||
| InstallPrinter | |||
| Router | |||
| Virus | |||
| GameConsole | |||
| Streaming | |||
| CableBox |
Table 5: Percentage Fof participants self-reporting they feel confident completing technical activities without assistance in this validation study compared with selection rates from our prior two studies.
These self-reported technical activity percentages were similar for this sample relative to the mean from the previous two studies for installing a phone app (2% higher) and a printer (1% lower), dissimilar for using Excel formulas (10% lower) and installing a router (9% lower), and substantially lower for removing a virus (18%), consistent with our hypothesis from the previous studies that participants recruited from Amazon’s Mechanical Turk tend to have a relatively high level of tech savviness.
Table 6 shows the distribution of the total number of activities participants reported being able to complete. All participants reported being able to complete two or more activities. Roughly half the participants (54.3%) reported being able to confidently perform seven or eight activities. The absence of Java programming, HTML programming, and network troubleshooting from the activities list very likely restricted the range of this metric relative to the previous studies.
| Validation Study Activity Score | Count | Percent | Cumulative Percent |
|---|---|---|---|
| 0 | 0 | 0.0% | 0.0% |
| 1 | 0 | 0.0% | 0.0% |
| 2 | 3 | 6.5% | 6.5% |
| 3 | 3 | 6.5% | 13.0% |
| 4 | 6 | 13.0% | 26.1% |
| 5 | 6 | 13.0% | 39.1% |
| 6 | 3 | 6.5% | 45.7% |
| 7 | 15 | 32.6% | 78.3% |
| 8 | 10 | 21.7% | 100.0% |
Table 6: Number of total selections from the activity checklist in the validation study.
Task Metrics
The task success rate is shown in Table 7. While most participants were able to connect the computer to the TV via an HDMI cable, fewer than half (47%) were ultimately able to stream a YouTube video to the TV in the allotted ten minutes.
| Task Step | |
|---|---|
| TV Success (On+HDMI connected to TV & PC regardless of input channel) | |
| HDMI Input Source Success | |
| YouTube Drag/Duplicate Success |
Table 7: Successful completion rates for the three task steps.
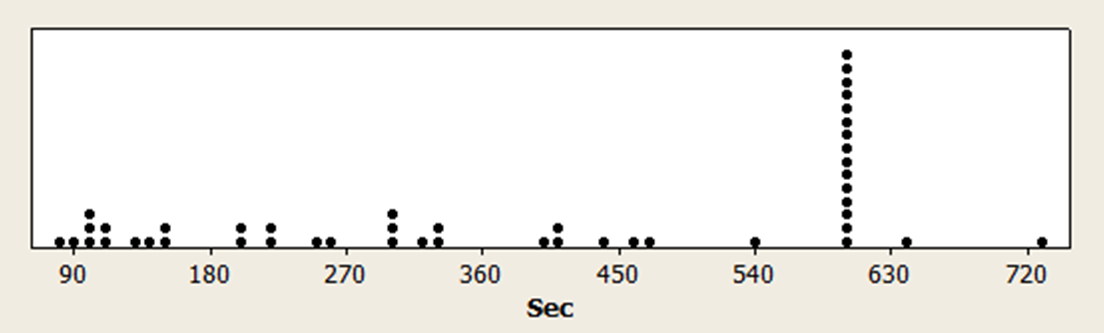
The median time spent attempting the task was 382 seconds (6 min 22 seconds), with 15 participants reaching the maximum time (Figure 2). Two participants were allowed to finish the step they were working on (one ultimately was successful and one was not).
The ease and confidence ratings are shown in Table 8. Participants rated setting up the hardware (cable and monitor) as considerably easier than displaying the video and mirroring. Note that due to time constraints, nine participants were not presented with the software ease and confidence questions. The hardware mean of 6.11 was significantly above the SEQ’s historical average of 5.5 (t(45) = 2.83, p = .003), while the software mean of 4.84 was significantly below average (t(36) = 1.68, p = .05).
| Metric | Mean | SD | N |
|---|---|---|---|
| Ease Hardware | 6.11 | 1.46 | 46 |
| Confidence Hardware | 5.85 | 1.84 | 46 |
| Ease Software | 4.61 | 2.39 | 37 |
| Confidence Software | 4.84 | 2.71 | 37 |
Table 8: Mean, SD, and sample size of ratings for participants.
Participants especially struggled with mirroring the computer on the TV. For example,
“I thought by plugging it in, my screen would be reflected on the TV, but there appears to be some setting, so I will go to preferences—anything that might have, I don’t know what I’m looking for—I feel like maybe my computer is like an external drive.“—Participant 29
“It’s kinda reminding me of having two computers, but then you have to figure out how they talk to each other, so this screen projecting what this screen is showing.“—Participant 9
Associating Tech-Savvy Ratings with Behaviors
We computed an overall tech-savvy self-assessment score by averaging all eight attitude items and a total technical activity score by counting the number of activities selected from the eight-activity checklist. Table 9 shows the correlations between these tech-savvy metrics with the task metrics of success, time, and ease (software and hardware ease), all significantly different from 0 (p < .10) except for the correlations between task time and the two tech-savvy metrics (Mean Attitude and Activity Score).
| Task Metric | Task Time | Task Success | Mean Attitude | Activity Score | Ease HW |
|---|---|---|---|---|---|
| Task Success | −0.57* | ||||
| Mean Attitude | 0.04 | 0.29* | |||
| Activity Score | −0.16 | 0.42* | 0.61* | ||
| Ease HW | −0.26* | 0.56* | 0.23* | 0.38* | |
| Ease SW | −0.69* | 0.83* | 0.29* | 0.35* | 0.34* |
Table 9: Correlations of tech-savvy metrics with task metrics (* = significant difference with p < .10).
The correlation between the Activity Score and post-task metrics was higher than the Mean Attitude score for task success (r = .42 vs. .29, not a statistically significant difference, p = .28), hardware ease (r = .38 vs. .23, not statistically significant, p = .22), software ease (r = .35 vs. .29, not statistically significant, p = .66), and task time (r = −.16 vs. .04, not statistically significant, p = .13. Note that negative correlations with task time are expected).
We were encouraged by the reasonably strong correlations between the tech activities and task metrics and wanted to explore this relationship further. Table 10 shows the task success rate crossed by whether participants reported being able to complete the tech activities. An impressive five of the eight showed statistically significant differences in task completion rates (p < .10). Participants were approximately twice as likely to complete the task if they reported being confident installing a printer (79% vs. 33%) or connecting a streaming device to a TV (83% vs. 43%), activities that are similar to the task participants attempted in this validation study.
| Technical Activity | Task Success if Selected | ||
|---|---|---|---|
| Yes | No | Diff | |
| Connecting a game console or Blu-ray player to a TV.* | 80% | 62% | 18% |
| Installing a printer on your computer.* | 79% | 33% | 45% |
| Setting up a wireless router.* | 82% | 56% | 25% |
| Connecting a streaming device to a TV.* | 83% | 43% | 40% |
| Installing a new app on your phone. | 76% | 50% | 26% |
| Using Excel formulas.* | 83% | 67% | 16% |
| Connecting a cable or satellite box to a TV. | 76% | 70% | 6% |
| Detecting and removing a virus from your computer. | 72% | 78% | −5% |
Table 10: Differences in technical activity selection rates as a function of successful task completion (* = significant difference with p < .10).
In looking at the distribution of the number of activities (out of 8) from Table 6, there is a natural cut point at the 50th percentile for those who reported being confident doing seven or eight activities as “high tech-savvy” and those confident doing six or fewer as “low tech-savvy.”
The average task completion rate for low-tech-savvy participants was 38% compared to 57% for high-tech-savvy participants. An N−1 two-proportion test indicated the 19-point difference wasn’t statistically significant (p = .23, n = 44 due to missing data for two participants). Future research with a larger sample size and an extended checklist metric range, achieved by adding back the high-tech activities of programming with Java, using HTML, and network troubleshooting, may allow more accurate identification of useful cut points.
Possible Covariates
While the study had enough statistical power to detect large differences in completion rates and medium-sized correlations, we anticipated that more subtle effects from gender, age, or computer preference differences might be less likely to reveal themselves in this study.
Gender
Men tended to select more activities than women (6.4 vs. 5.6), but this difference wasn’t statistically significant (p = .17). We found no significant gender differences in completion rates (which were identical for men and women) or task times (p = .60).
Age
There was no significant difference in the number of activities selected by age cohorts (p = .12). However, there were significant differences in task completion rates by age. Table 11 shows how the completion rate significantly dropped off with age, comparing those <50 years old with those 50+ using an N-1 two-proportion test (<50 years: 61%, 50+ years: 8.5%, p < .05).
| Age | Completion Rate | Sample Size |
|---|---|---|
| <25 | 67% | 9 |
| 25–39 | 57% | 14 |
| 40–49 | 60% | 10 |
| 50–59 | 17% | 6 |
| 60+ | 0% | 5 |
Table 11: Differences in completion rates by age cohort.
An ANOVA also found a significant main effect of age on task times (p = .051), driven by the difference in mean times between those 60+ versus those under 25. The youngest cohort spent less than half the time as the oldest on the task (266 vs. 540 seconds).
Mac vs. PC
Finally, participants who used a Mac were slightly but not statistically more successful at completing the task (78% vs. 67%). PC users spent a substantially and significantly greater amount of time attempting the task (443 vs. 292 seconds, 52% longer, p = .01). There were no significant differences in ease or confidence scores between PC and Mac users.
Summary and Discussion
Based on our findings from an in-person moderated study conducted in 2018 with 46 participants who completed a tech savviness screener and attempted a technical task,
Two approaches to the measurement of tech savviness—attitudinal self-assessment and activity checklist—continue to show promise. The means and standard deviations for each of the eight attitudinal self-assessment items were consistent with those collected in the previous refinement study, and the average of the eight items had modest but significant correlations with task success and ratings of task ease (r = .23 to .29). The selection percentages from the activity checklist were less consistent with the refinement and pilot studies, but this is likely due to differences in the sampled populations. The activity checklist scores also had significant correlations with task success and ratings of task ease (r = .35 to .42). The correlation between self-assessment means and activity checklist scores was .61 (36% shared variance, evidence they are potentially alternate measures of tech savviness).
Of the two approaches, we plan to focus on further improving and validating the activity checklist. Simply counting the total number of technical activities selected from a checklist tended to be more predictive (correlate more highly) of successful task completions and ease ratings than the mean of the self-assessment ratings (though not significantly higher). More importantly, the activity checklist method seems to be less range restricted than the self-assessment items, which means it has the capacity for stronger correlation with other metrics and is more suitable for the establishment of cut points for the categorization of low, medium, and high levels of tech savviness. One way to improve the range of the activity checklist score would be to restore three very technical activities included in previous research—Java programming, using HTML, and network troubleshooting.
We also plan to continue studying and refining our battery of tech-savvy self-assessment items. Even though the activity checklist seems to be the more promising approach, we have not given up on developing an alternate way to assess tech savviness using self-assessment items. After all, the mean of the items used in this study correlated strongly with the activity checklist score (r = .61). An issue with the current version is that some of the items seem to be redundant (having similar means and standard deviations), and the range of item means is small relative to the maximum possible range of a five-point scale (.8/4 = 20%, contrasted with about 80% for an activity checklist that includes Java programming and installing a new app on a phone). To increase the range for self-assessment items, we will need to develop some items that are harder for people to agree with.
Age was a good predictor of task completion and times. Younger participants were more than seven times as likely to complete the task as older participants. For task completion rates, participants younger than 50 years had an average completion rate of 61%; those 50 years or older averaged 8.5% successful task completion. For task times, the youngest group (less than 25 years) completed the task more than twice as quickly as the oldest group (60+).
Limitations: This moderated usability study had a relatively small sample size, limiting claims of statistical significance to large effect sizes. Also, it had only one task, limiting its generalizability.
Future research: Our focus for future research is to include a modified activity checklist in several large-sample multi-task usability studies (remote and moderated) to improve the generalization of this initial validation with additional task completion findings and to explore different methods for categorizing participants as having low, medium, or high levels of tech savviness.


