 If you’ve had a meeting recently it was probably a virtual meeting.
The use of online meeting software with integrated video and screen sharing capabilities, such as Zoom and Google Hangouts, has been growing for years. To say the usage has now skyrocketed is probably an understatement.
Online meetings are ubiquitous in business and are now common in education and personal use. Children attend classes online, doctors and therapists consult their patients virtually, governments convene remotely, and piano lessons, gym classes, and happy hours are all happening online. And that’s thanks to online meeting software.
Millions of people are now using these software interfaces that offer amazing functionality, but like in all software, they are also encountering some pain points.
Zoom has become a part of everyone’s vernacular but, unfortunately for some, so has Zoombombing, where uninvited guests join meetings, striking fear into parents of school-aged children everywhere.
As it happens, we have been measuring the user experience of meeting software platforms for a few years now and publish common UX benchmarks for them such as the SUS and NPS.
Our most recent 2020 benchmark report, which included meeting software, concluded at the end of 2019, right before the surge in usage from the pandemic.
In this unusual time, we wanted to see whether people’s attitudes have changed. To find out, we conducted another benchmark study, this one focused on meeting software.
Meeting Software Benchmark Study
In early April 2020, we conducted a retrospective study with 198 U.S.-based panel participants. This study included metrics from our standard UX and NPS survey, plus additional items focused on the experience of using meeting software.
A bit over half (58%) were male and tended to be younger, with 73% under 35. Participants were asked to reflect on their most recent experiences with the software and answer a number of items, including the System Usability Scale (SUS) and the standard likelihood-to-recommend question used to compute the NPS. They were asked to answer questions about the meeting software that they had reported having recently used. The products and sample sizes were:
- Google Hangouts: 49
- GoToMeeting: 37
- WebEx: 58
- Zoom: 54
Here are some highlights of the current research on meeting software, with comparisons to the earlier research when possible.
Loyalty
Net Promoter Scores
The most popular method to measure loyalty is the Net Promoter Score (NPS). It’s calculated using an 11-point (0 to 10) likelihood-to-recommend (LTR) question, with the NPS computed by subtracting the percent of detractors (0–6) from the percent of promoters (9–10).
Figure 1 shows the NPS for the four meeting software products for each quarter for which data were gathered (4Q19, before COVID-19, and 1Q20, after COVID-19 onset; no 4Q19 data for Hangouts).
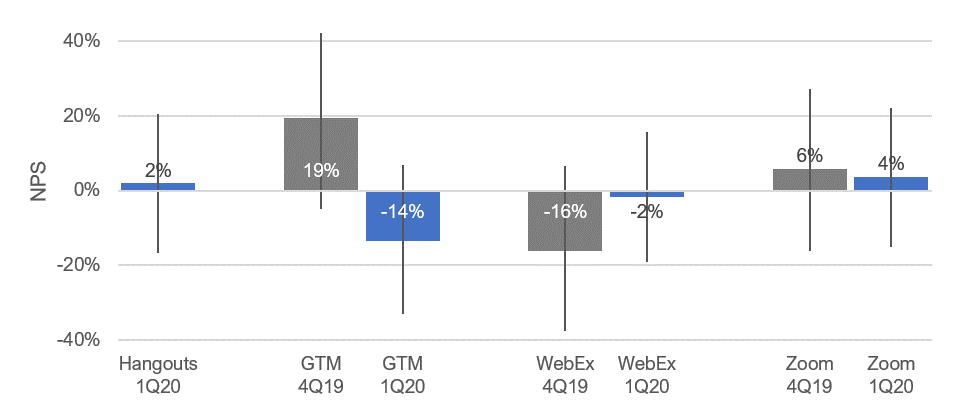
Figure 1: Net Promoter Scores and 90% confidence intervals for four meeting software products between 4Q19 and April 2020.
The two most notable shifts were for GoToMeeting that dropped from an NPS of 19% to −14% and WebEx that improved from −16% to −2%. The drop for GTM was statistically significant when comparing the means of the underlying likelihood-to-recommend question (p = .02).
Note that the NPS’s net-box metric loses precision, which makes detecting differences with small (but adequate) sample sizes harder.
System Usability Scale (SUS) Scores
We used the popular System Usability Scale (SUS) to compute the perceived ease of use of the four products. SUS is a ten-item questionnaire with possible scores ranging from 0 to 100. The average SUS score from over 500 products (including websites and business software) is 68 (a grade of C on the Sauro-Lewis curved grading scale).
Figure 2 shows the mean SUS scores for the meeting software products with matching grades (means ranging from 67.1 to 75.9, grades ranging from C to B).

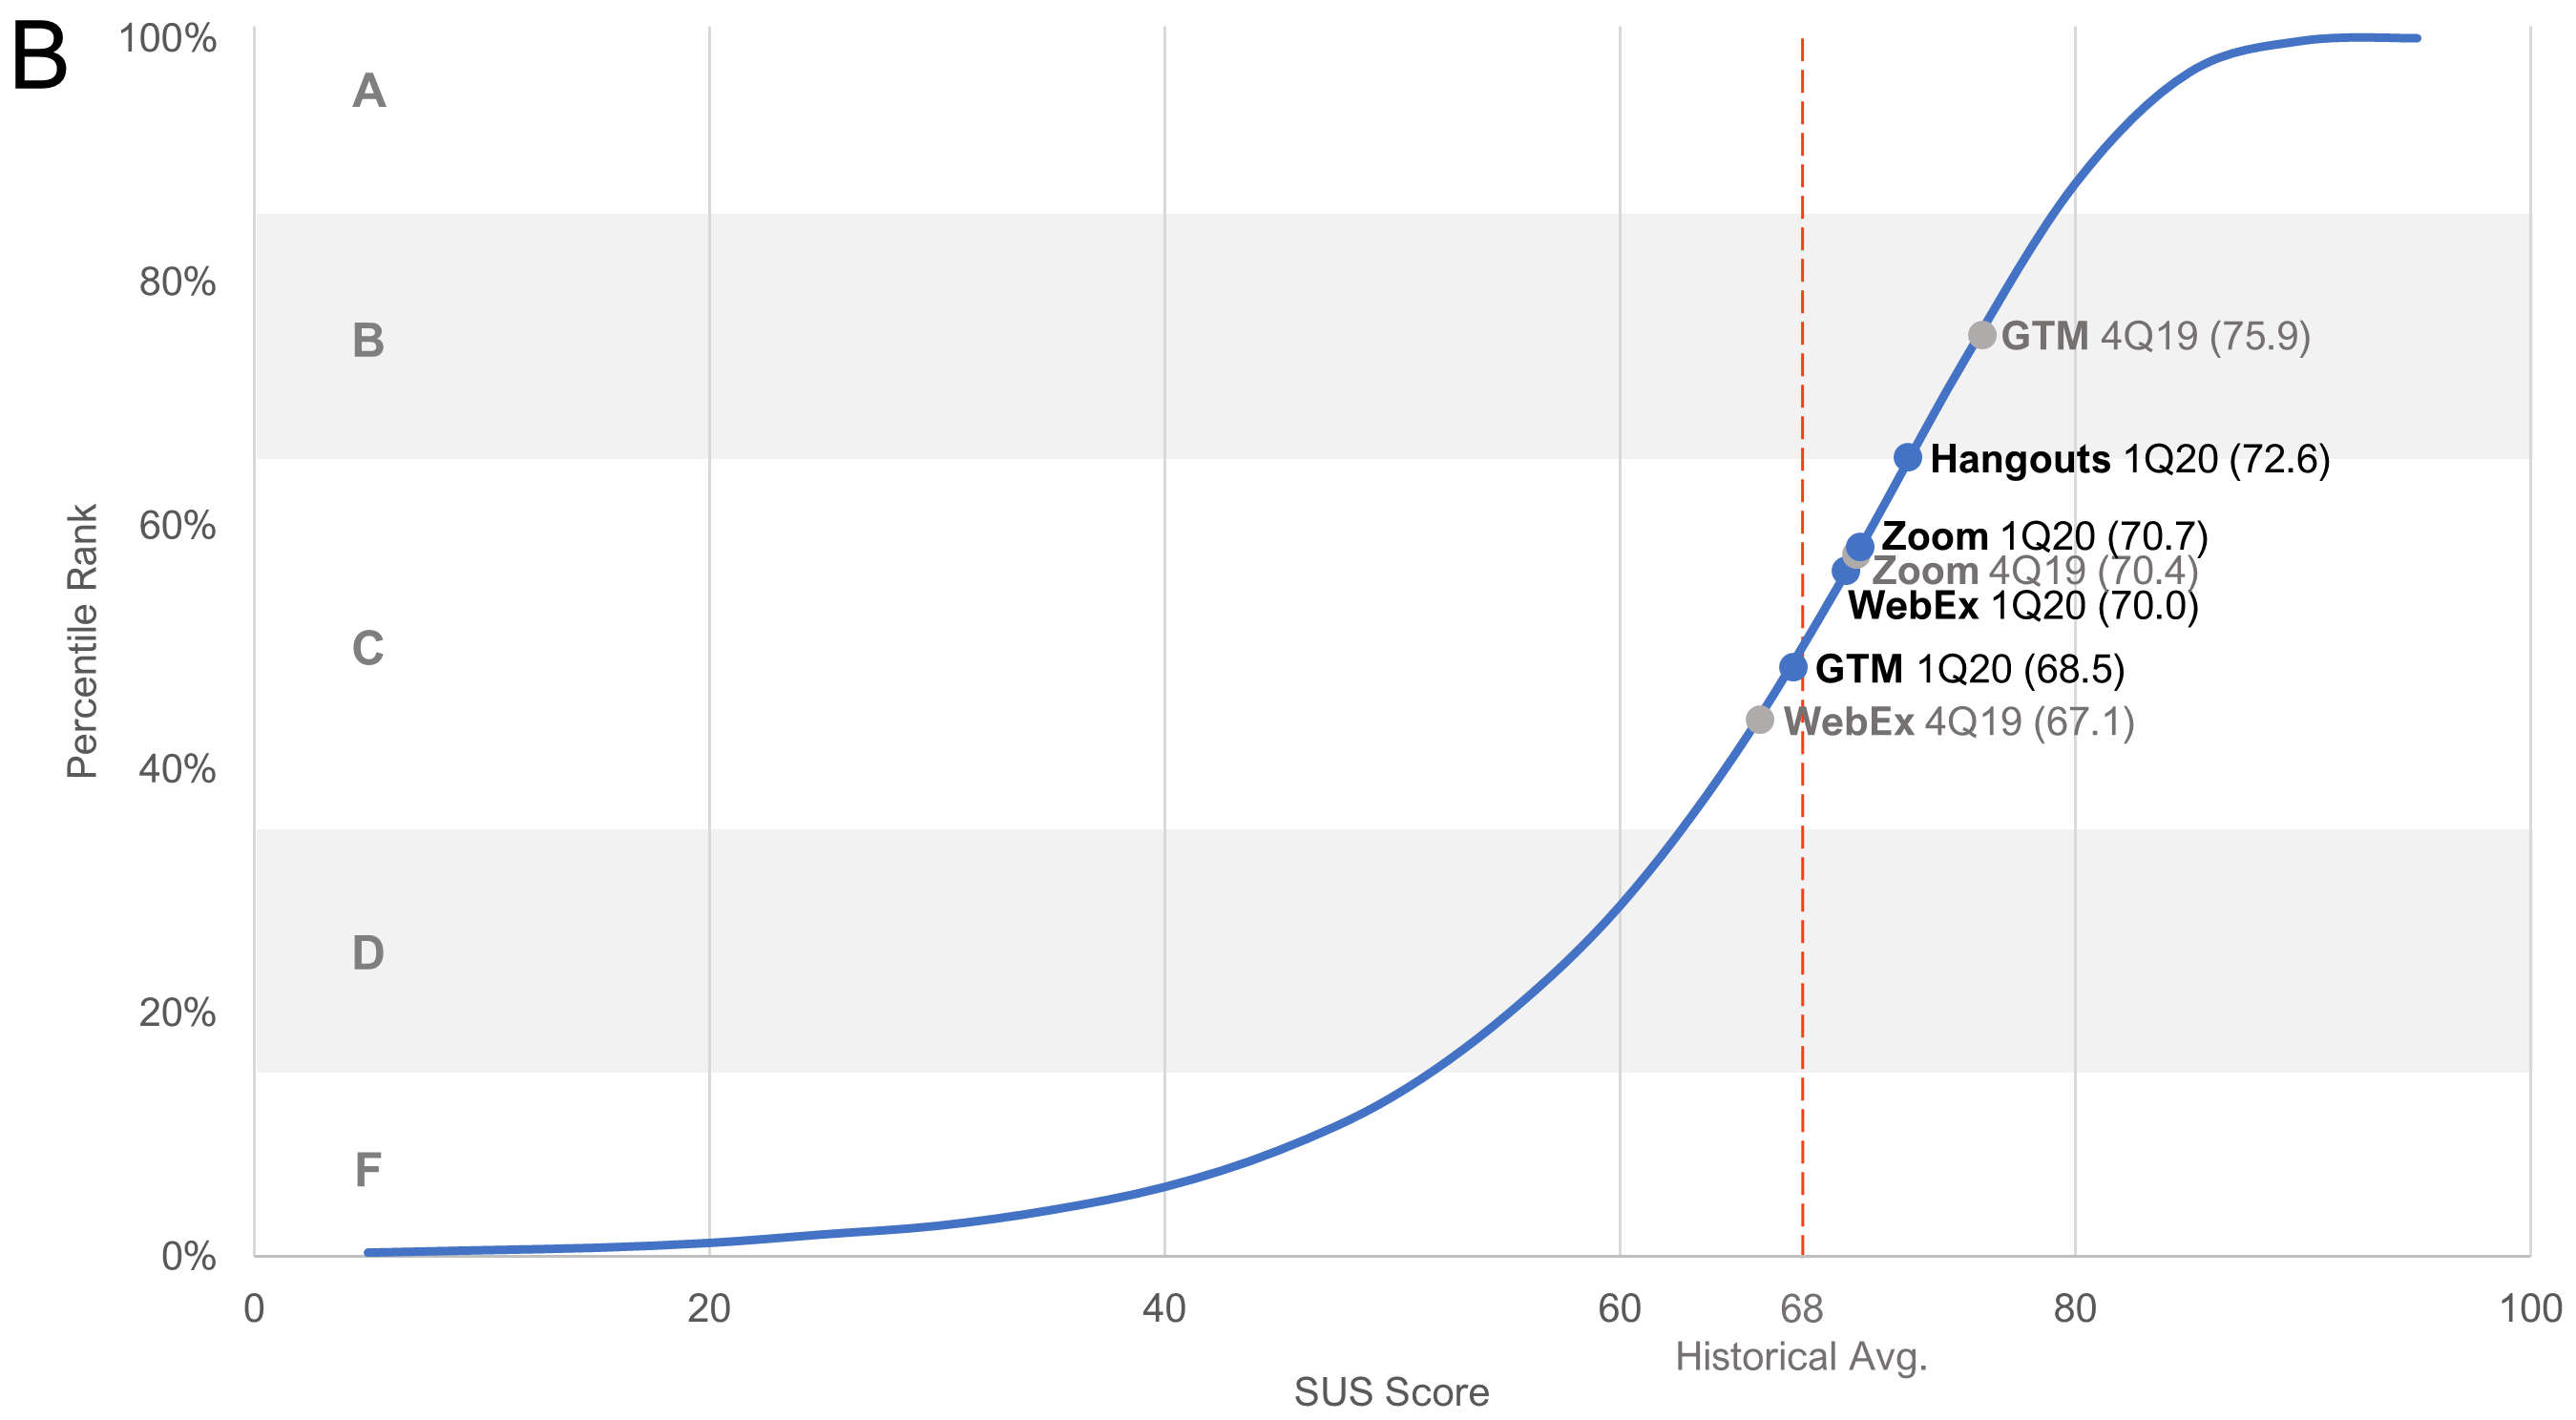
Figure 2: Mean System Usability Scale (SUS) scores for four meeting software products (with grades); both shown as (A) bar graph and (B) plotted along the percentile rank curve.
The SUS results were similar to the LTR results. There were no significant differences except for the drop in perceived usability for GoToMeeting from 4Q19 to 1Q20 (p = .03).
Usefulness and Ease
In these benchmark reports, we continue to present findings for the UMUX-LITE because it’s become an important benchmark for many organizations due to using a single (succinct) score to quantify software acceptance and satisfaction. It’s based on earlier work harkening back to the Technology Acceptance Model (TAM) but includes only one item each for ease (how easy is the software to use) and usefulness (how well the capabilities meet the users’ needs). In aggregate, it provides a measure of acceptance or, even more broadly, satisfaction in or quality of the product.
Figure 3 shows a scatterplot of the two components of the UMUX-LITE scores. The dotted red lines indicate the historical mean of the UMUX-LITE across a number of studies (68).
All four products over both time periods (except for Hangouts) are in the upper-right quadrant of the graph because both UMUX-LITE item scores for each condition are above average. Zoom has the highest relative usefulness score and shows an increase compared to just four months ago. This suggests users either more highly value its features or a new set of users are encountering the product.

Figure 3: Scatterplot of UMUX-LITE subscales for four meeting software products over two time periods.
Analysis of Verbatim Comments
To dig into the “why” behind the numbers we asked participants to name one thing they disliked and one thing they liked about the product they rated. We then coded the responses into categories. Tables 1 and 2 show the highest-frequency dislikes and likes from an analysis of those verbatim comments.
| Dislike Category | Hangouts | GTM | WebEx | Zoom |
|---|---|---|---|---|
| Trust issue | 4% | 3% | 0% | 30% |
| Poor video quality | 14% | 0% | 0% | 4% |
| Poor connection quality | 0% | 8% | 12% | 2% |
| Poor audio quality | 10% | 0% | 7% | 4% |
Table 1: Most frequent types of negative comments.
| Like Category | Hangouts | GTM | Webex | Zoom |
|---|---|---|---|---|
| Easy to use | 45% | 35% | 17% | 28% |
| Screen Sharing | 2% | 0% | 21% | 7% |
| Intergration with other apps | 18% | 3% | 2% | 0% |
Table 2: Most frequent types of positive comments.
Positive Comments
For positive comments, all four products received high marks for ease of use, though WebEx was a bit lower than the others. WebEx had the highest frequency of positive comments regarding screen sharing, and Google Hangouts had the highest frequency for its integration with other Google apps. Some of the positive verbatim comments were
Ease of use
Hangouts: “I trust that Google does put out quality content, and Google Hangouts does reflect that by being simple and easy to use.”
GoToMeeting: “I liked how easy it was to use and how easy it was to get a bunch of people together.”
WebEx: “It’s very straightforward. It’s incredibly easy to use and connect with no prior knowledge or experience.”
Zoom: “I like that it’s easy to use and it’s not hard to set up.”
Screen sharing
WebEx: “Screen sharing and switching presenters is very easy.”
Integration
Hangouts: “THE GOOGLE RUNS THROUGH MY VEIIIIIIIIIIIIIIIIIIIINS!!!! Heh. But no, seriously, my life is more or less completely integrated into The Google Overmind, making Hangouts chatting second nature to me.”
Negative Comments
In the previous survey (4Q19), the top recommendations for improvement for GoToMeeting, WebEx, and Zoom were responsiveness/audio/video/connectivity issues. In the current study (1Q20), audio/video/connectivity quality continue to be frequent complaints about GoToMeeting and WebEx (and Hangouts), with verbatim comments like
Hangouts: “Video can be choppy at times. Sometimes the audio does not work.”
GoToMeeting: “It seems like presenters regularly have connection issues, but I have never had any issues connecting to a meeting where I am a participant.”
WebEx: “Sometimes it runs slow.”
For Zoom, however, the dominant issue was trust. At 30%, the frequency of occurrence of negative comments about trusting Zoom was over twice that of the other issues. This is likely due to prominent news stories regarding weaknesses in its security once its popularity skyrocketed. Zoom has since taken steps to improve security, such as using passwords and putting attendees in a waiting room by default, but participants in the survey still made comments like:
Zoom: “I don’t like the issues with security that there have been, such as people hacking into meetings.”
Zoom: “I have heard that they do not have a good reputation for personal privacy and securing my data.”
Did Zoom’s Recent Security Issues Affect Its Users’ Likelihood to Recommend?
The Zoom situation led us to wonder whether these recently reported security issues affected users’ likelihood to recommend the product. To test this, we focused on just the Zoom data and split responses into two groups—those who weren’t concerned about security (n = 38) and those who were (n = 16). This is the kind of user concern that you would expect to affect a loyalty metric such as NPS but not a measure of perceived usability such as the SUS.
That’s exactly what we found. The mean SUS for the first group (not concerned) was 69 and for the second group (concerned) was 74. These scores were not significantly different (p = .20). We computed NPS separately for these groups, with the NPS of the first group (not concerned) equal to 21% (4 detractors, 22 passives, 12 promoters) and the NPS of the second group (concerned) equal to −38% (9 detractors, 4 passives, 3 promoters). The difference in the distributions of the NPS categories for the two groups was highly significant (p = .002).
We can’t know for sure, but without the effect on NPS apparently due to diminished trust, Zoom might have enjoyed a substantial lift to its NPS rather than just maintaining its score across quarters (see Figure 1).
Summary
Results of our meeting software benchmark from 198 participants revealed:
There are a few differences in UX metrics after COVID-19. Despite a massive increase in usage, we found relatively stable NPS and SUS scores; only GoToMeeting dropped compared to 4Q19.
Audio, video, and connectivity issues dominate. Analysis of verbatim comments showed consistent identification of negative aspects of user experience for both 4Q19 and April 2020 for GoToMeeting and WebEx (audio/video/connectivity issues), with similar observations for Google Hangouts (which was not part of the 4Q19 survey).
Meeting software is perceived as easy to use. The most frequent positive comments were for the ease of use of the four products. WebEx received a high frequency of positive comments about its screen sharing and Hangouts for its integration with other Google apps. All four products evaluated had SUS scores at or above average.
Trust affects Zoom loyalty. The most striking change in data between 4Q19 and April 2020 was a previously unseen high frequency of comments indicating a lack of trust in Zoom, likely due to news reports about security issues. The analysis showed that concerns about security did not affect perceived usability (SUS) but did affect product loyalty (NPS).
The full list of benchmarks and analysis of verbatim responses from the data collected in 4Q19 (which include a wide variety of business software other than meeting software products—19 in all) are available for purchase in the 2020 Net Promoter & UX Benchmark Report for Business Software.
")
")
