Public officials don’t care much about what the general public thinks.
Voting is the only way ordinary people can have a say in government.
How much do you agree with those two statements?
If the order in which those items were presented were switched, would it affect how you responded?
While most UX and customer research doesn’t involve sensitive topics, does the order in which items are presented in common metrics like the Net Promoter Score matter? To investigate this, we need to first understand order effects in surveys.
Order Effects
There is a well-documented order effect in surveys. That is, the order in which questions or items are presented in a survey can have an effect on how people respond.
The causes of the order effect include being primed by earlier items and a desire for respondents to be consistent (or appear consistent) in responses and avoid cognitive dissonance.
If people agree to one item, it may push them to agree to another item to appear consistent, even if they don’t necessarily feel that way. Other reasons may be subtler; for example, thinking about more specific items. Even negatively or positively worded items may activate different thoughts and hence affect responses.
In the seminal book by Schuman and Presser, where I pulled the above examples that were tested in a study, they describe the order effect as “not pervasive…but there are enough instances to show that they are not rare either” (p. 74).
The published literature on order effects indicates that it’s not always clear how results will differ when the order is changed and whether there always is an effect. The effect depends at least on the topic being addressed with more sensitive topics being susceptible to the influence of earlier items. Tourangeau and Rasinski (1988) describe the order effect as being “difficult to predict and sometimes difficult to replicate.”
General vs. Specific Order Effect
One manifestation of the order effect is something called a general-specific order effect. That is, asking a general question (how satisfied are you overall with life?) versus a specific question (how satisfied are you with your marriage?…with your job?) can have an effect on both the correlation between items and the mean responses.
For example, Kaplan et al. (2012) analyzed the general satisfaction of military recruiters in one study (n = 6,000) and job satisfaction in another (n = 88), reversing the order of general and specific items. They found lower mean scores and higher correlations when the general items came before specific items (e.g. general: “All in all, I am satisfied with my job” and specific: “Rating the number of hours I work”).
They recommended putting general items first to “obtain the most unbiased estimates of means, standard deviations and correlations between the content of their scales.”
In another study, Auh et al. (2003) examined people’s satisfaction with their hair care provider (n = 191). They also found slightly (~6%) lower mean scores when general satisfaction and loyalty items were first. However, in contrast, they found explanatory power was the same or higher when the attribute items (e.g. “My hair care provider cuts my hair evenly”) came before the general ones (e.g. “Overall satisfaction”).
The authors suggest being consistent and, in some domains—for example, when asking about computers or expensive household appliances—to ask specific attributes first, then overall questions second (which may be more natural for respondents). These two studies from the literature show some similarities (there is a general-specific order effect) but don’t show the same patterns.
Order Effects in UX/CX
There isn’t much research specifically examining order effects in UX or CX. For example, Jim Lewis recently examined the effects of order on usability attitudes and didn’t find an order effect when alternating the SUS, UMUX, or CSUQ.
For the Net Promoter Score, there is at least one report that if you ask the “would recommend” question used to compute the NPS early in a survey, the score will be higher than if you ask it later in the survey but no data is given on the size of the effect.
For the SUPR-Q, which incorporates the Likelihood to Recommend item, Heffernan found that their Net Promoter Score dropped if they asked it after the other seven SUPR-Q items. It’s unclear though whether this effect was a result of the presentation format (one at a time) and/or from high attrition on their web survey.
We’ll need more data to decide.
Study 1: Early vs. Late NPS
To look for evidence of an order effect with the NPS we conducted our own study to see whether scores change based on when questions are asked in a survey. In November 2018, we surveyed 2,674 respondents online and asked them to think about a product or service they most recently recommended. We then asked them how likely they would be to recommend the same product to another friend or colleague (the LTR item).
We varied when we presented the LTR item. It either appeared early in the survey (after about 40 questions about demographics and social media usage, and other Likelihood to Recommend questions about other brands) or later in the survey (after 72 items). We created several batches of surveys. Each batch alternated the order of when participants would see the LTR item with 1,015 participants receiving it early and 1,657 seeing it later in the survey.
We found little evidence to suggest an order effect with this setup. The mean responses differed only slightly (by .1 point) and not statistically significantly between the two groups (p = .9). In this data, the mean LTR value was 8.8 vs. 8.9.
In examining the percentage of respondents that selected each number on the 11-point LTR scale we also saw very similar percentages as shown in Table 1, suggesting there was little movement in both the mean or extreme responses.
| LTR | Early | Later |
|---|---|---|
| 0 | 1% | 1% |
| 1 | 0% | 0% |
| 2 | 0% | 0% |
| 3 | 0% | 0% |
| 4 | 0% | 1% |
| 5 | 3% | 3% |
| 6 | 3% | 2% |
| 7 | 9% | 7% |
| 8 | 15% | 16% |
| 9 | 16% | 17% |
| 10 | 52% | 52% |
Table 1: Differences in respondents selecting each LTR option depending on when it was presented (early vs. later) in a survey.
In examining the open-text responses of the companies people recommended, we found six appeared at least 30 times. I compared the mean LTR response by company and again found no statistical difference or even discernable pattern based on when the LTR item appeared (see Table 2). Half the companies had higher LTR scores when the item was later in the survey and half had higher scores when the item appeared earlier in the survey.
| N | LTR Early | LTR Later | Diff | p-value | |
|---|---|---|---|---|---|
| Amazon | 110 | 9.4 | 9.3 | 0.1 | 0.793 |
| Walmart | 42 | 9.3 | 8.7 | 0.6 | 0.298 |
| Ebay | 42 | 9.4 | 8.9 | 0.5 | 0.403 |
| Target | 40 | 9.3 | 9.4 | -0.1 | 0.823 |
| Spotify | 33 | 8.6 | 9 | -0.4 | 0.395 |
| Hulu | 30 | 8.7 | 9 | -0.3 | 0.447 |
Table 2: Mean LTR scores by company based on when the LTR item was presented (early vs. later).
Study 2: NPS Before and After SUPR-Q
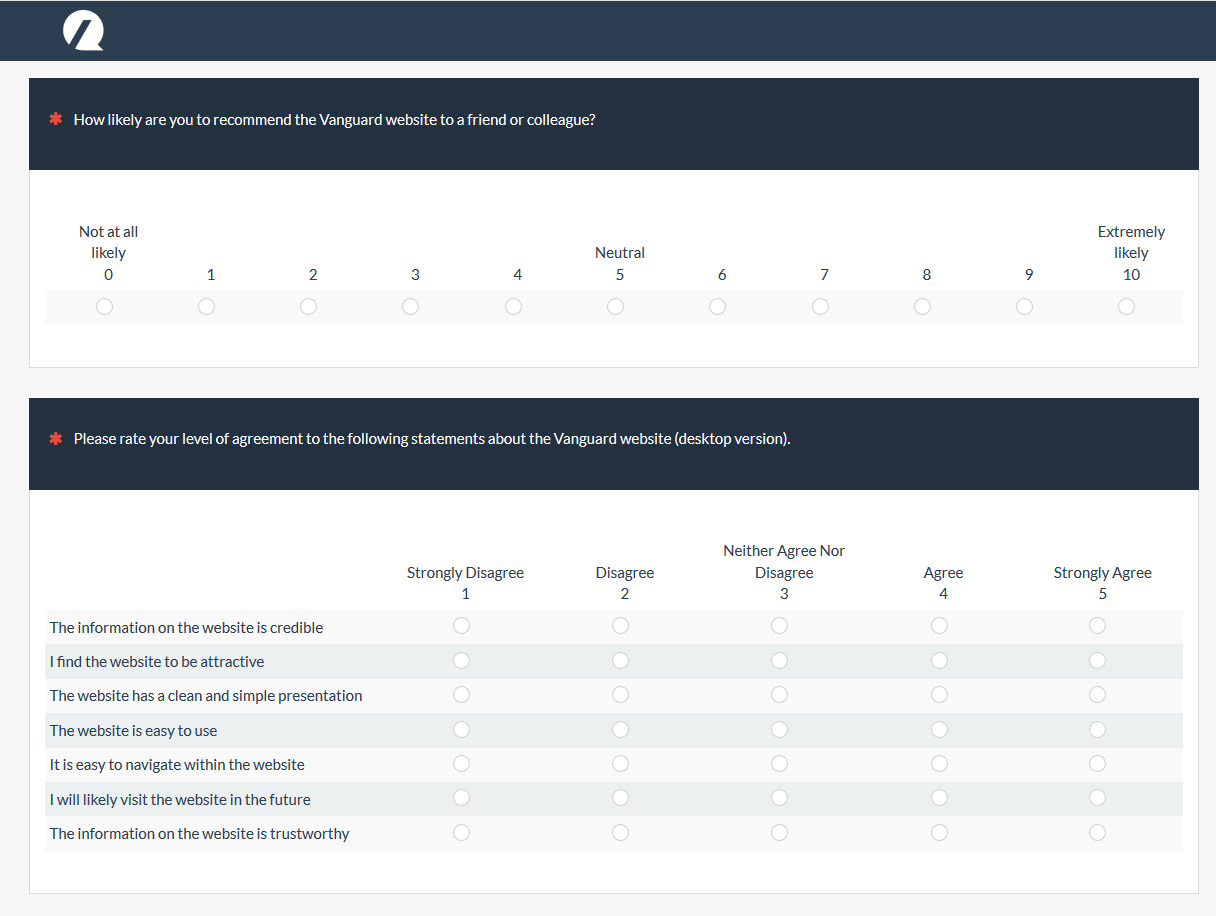
In another study we looked at the effect of the SUPR-Q items on the Net Promoter Score (mean of the LTR item). Data was collected from 501 participants in October and November 2018. Participants in the study were reflecting on one of six brokerage websites or a recent experience on one of six restaurant websites. Participants either were asked the Likelihood to Recommend item before the seven SUPR-Q items or after. All eight items were presented on the same page but their order on the page was swapped for roughly half the respondents across the 12 websites (see Figure 1).
Figure 1: LTR item shown before other SUPR-Q items was found to have slightly more explanatory power but the same means compared to the LTR being shown after the SUPR-Q items.
We found the mean response on the LTR item was virtually identical (8.26 presented before vs. 8.25 presented after). We also found no difference in the mean scores for the seven other SUPR-Q items (4.25 before vs. 4.28 after); p = .641.
Effects on Explanatory Power
In some cases, researchers may want to predict users Likelihood to Recommend score from the SUPR-Q items (e.g. how much does ease or trust affect LTR) so we looked to see whether the explanatory power differed based on the presentation order. This time we did see a small effect.
When the LTR was presented first, it led to more explanatory power than when the LTR item followed the seven SUPR-Q items. The adjusted R-square went from 40.2% with five items when the LTR was first to 32.6% with four items when the LTR followed.
This result is actually in contrast to the Auh et al. study but in agreement with the Kaplan et al. study that found more explanatory power when the broader measures were presented first. The difference we observed was smaller and the seven SUPR-Q items aren’t the same sort of specific attributes (they’re also broader attitudes than asking about things like website features) so may explain some of the difference in results. Future research is needed to see whether this effect remains.
Summary and Takeaways
In this article, I reviewed some of the published literature on order effects and then discussed the findings of two online experiments that manipulated the order of the Likelihood to Recommend item. We found:
Net Promoter Scores aren’t impacted by order. We saw the LTR means (and the distribution of scores) were virtually identical whether they were placed earlier in the survey or later in both studies involving different websites and a mix of companies and products. We also found placing the LTR item before the more specific seven SUPR-Q attitude items on 12 websites also didn’t affect the mean scores.
There’s a possible difference in explanatory power. We found that having the LTR before the SUPR-Q items increased the explanatory power (adjusted R-square) by about seven percentage points. This was consistent with one other study but conflicted with another. The SUPR-Q items aren’t as specific an attribute (such as pricing or features) so this may explain some of the differences in one study and future research with another data set would be needed to confirm these findings.
Order effects are real, not rare, but hard to predict. This analysis is consistent with other published research that has found order effects exist, but it’s unclear when and how large of an effect. There are many variations on how the Likelihood to Recommend item can vary (e.g. being alone vs. with other items or alone on a page) and more data is needed. In the interim, be careful about assuming how changing the item order will affect scores without any data on the specific items collected from the same type of participants in a similar context.
Context is a mitigating effect. The published literature shows that the topic, context, and order manipulations may all create different types of order effects. In our first study, several items preceded the first presentation of the LTR and more were before the second placement. It could be that an order effect is attenuated because of the larger number of questions or it may be masked by other questions. It could also be that people’s attitude toward recommending is less susceptible to order. Future research can also isolate these effects.


