There are many ways to format rating scales. Recently we have explored
- Labeling neutral points
- Labeling all or some response options
- Altering the number of response options
- Comparing agreement vs. item-specific endpoint labels
Each of these formatting decisions has a variety of opinions and research, both pro and con, in the scientific literature at large. Our controlled studies on these topics in the context of UX measurement usually find no significant difference as a function of format. When there is a statistically significant difference, the magnitude of the effect tends to be small. A notable exception in our recent work gives evidence that having just three response options in single rating scales is markedly insufficient for accurately capturing attitudes and sentiments such as likelihood-to-recommend.
Until recently, we had not explored differences in numeric versus graphical item formats (e.g., clicking one to five stars to indicate the magnitude of a sentiment, or setting the number with a slider control). We now have data collected using a two-item UX questionnaire, the UMUX-Lite, with (1) standard Likert agreement scales (linear numeric), (2) Amazon-like five-star items, and (3) slider scales. In this article, we focus on the comparison of ratings with numbers and sliders.
What Are Slider Scales?
Figures 1 and 2 show examples of numeric- and slider-scale versions of the UMUX-Lite.
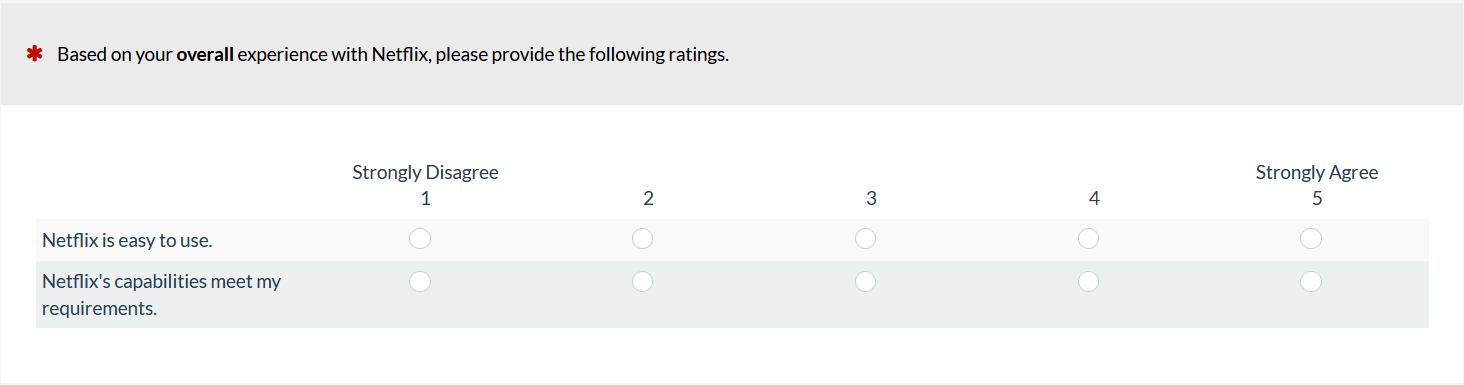
Figure 1: Example of a numeric version of the UMUX-Lite (created with MUIQ).
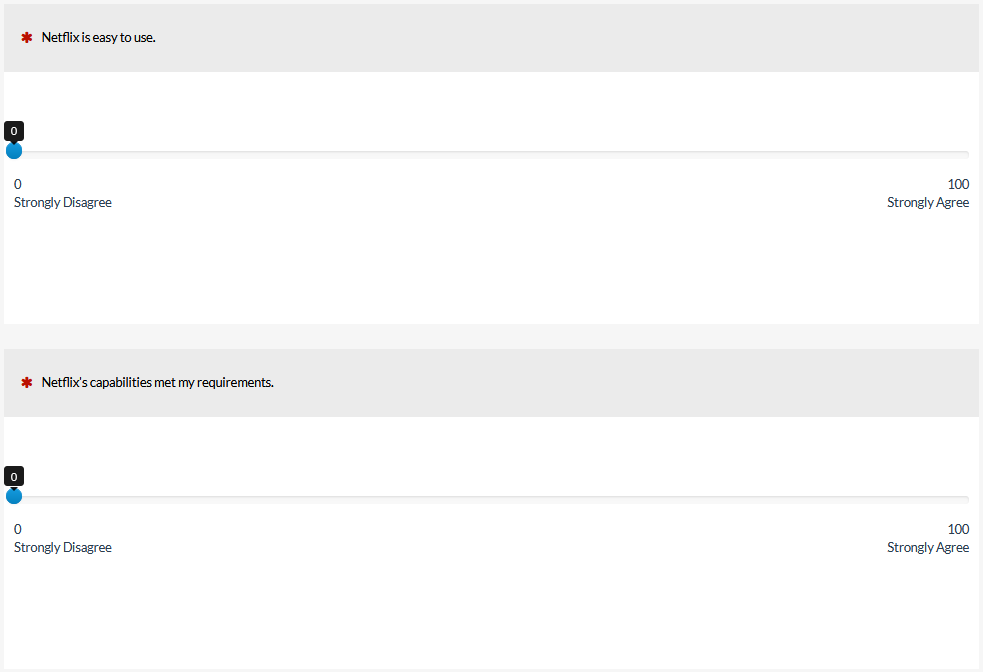
Figure 2: Example of a slider version of the UMUX-Lite (created with MUIQ).
Due to their design, sliders require more physical space than numeric scales. Within the category of slider scales, there are different formats. For example, some sliders display a limited number of response options (e.g., five), so the only difference with a standard numeric scale is the user interface used to select the response option (click for numeric; drag-and-drop for slider). More often, sliders cover a wide range of response options (e.g., as shown in Figure 2, from 0 to 100). Some sliders require dragging the slider control to the desired position with a mouse, touchscreen, or other pointing device—a user interface design that is difficult for some users (e.g., Chyung et al., 2018).
Other slider designs allow, in addition to sliding, simply clicking on the desired position and then fine tuning as required with any combination of dragging and clicking (which is the case for sliders in MUIQ). These types of sliders are also known as visual analog scales (VAS) due to their similarity to older pencil-and-paper VAS, on which users marked a position on a line to indicate the magnitude of an attitude or sentiment (typically a 10-cm line with the marked position measured by hand to produce a rating from 0 to 100).
What Does the Literature Say about the Difference?
As is usually the case when discussing scale formats, the literature is inconsistent regarding the advantages of sliders over numeric scales. The opinion consensus tends to favor sliders based on hypothesized advantages in respondent engagement and psychometrics, but data-based findings are mixed. For example:
- Joyce et al. (1975) found the VAS was more sensitive than a four-point numeric pain scale.
- Sauro and Dumas (2009) found the SMEQ (Subjective Mental Effort Questionnaire), a 150-point VAS-like scale, was slightly more sensitive than the seven-point SEQ (Single Ease Question).
- Several researchers have reported better results for numeric scales than VAS regarding completion time (Couper et al., 2006; Rausch & Zehetleitner, 2014), completion rates (Couper et al., 2006; Davey et al., 2007), and respondent preference (van Laerhoven et al., 2004; van Schaik & Ling, 2007).
- Respondents, especially in clinical settings, sometimes have more trouble physically completing VAS than numeric scales (Bolognese et al., 2003; Briggs & Closs, 1999; Jensen et al., 1986).
- Toepoel and Funke (2018) found more nonresponses with sliders than radio buttons and reported poorer performance with slider bars that required dragging-and-dropping than with more VAS-like sliders.
- Across several studies comparing VAS with numeric scales having from 4 to 20 response options, there was no significant or practical difference in psychometric properties between the two (Bolognese et al., 2003; Couper et al., 2006; Davey et al., 2007; Larroy, 2002; Lee et al., 2009; Lewis & Erdinç, 2017; Rausch & Zehetleitner, 2014; van Laerhoven et al., 2004; van Schaik & Ling, 2007).
Sliders vs. Numbers Experiment
Because our primary interest is how variation in item format affects measurement of the user experience, we set up a Greco-Latin experimental design to support a within-subjects comparison of UMUX-Lite ratings of a variety of streaming entertainment services (Netflix, HBO Now, Amazon Prime Video, Hulu, and Disney+ — for more information see our article and downloadable report). Specifically, 335 participants from a US panel agency rated the streaming entertainment services from May through June 2020, and out of this larger sample, 180 participants provided ratings with numeric and slider scales.
With this experimental design, there were three independent variables:
- Item Format (linear numeric; VAS slider—see Figures 1 and 2)
- Rating Context (rating of most recent experience with the service; rating of the overall experience with the service)
- Order of Presentation (numeric/recent then slider/overall; numeric/overall then slider/recent; slider/recent then numeric/overall; slider/overall then numeric/recent)
Participants were randomly assigned to one of the four orders formed by the crossing of Item Format, Rating Context, and Order of Presentation. Across the experiment, this controls for the “nuisance” variables of Rating Context and Order of Presentation. (In addition to the experiments we conduct for ourselves, we also use this study design for client projects when we need to efficiently control nuisance variables and want the enhanced precision of a within-subjects design.)
Figure 3 shows the key result of the experiment—almost identical mean scores for Numeric (83.9) and Sliders (84.5). An analysis of variance, which simultaneously assessed the statistical significance of all three main effects and their interactions, indicated no significant main effects or interactions (all p > 0.20 with 176 error df).
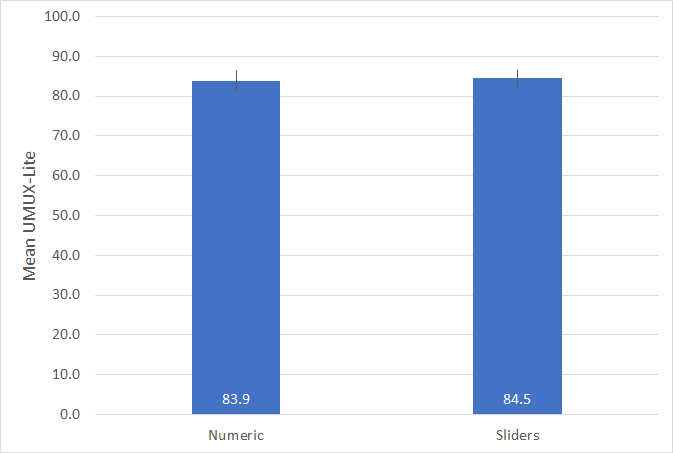
Figure 3: UMUX-Lite means (and 95% confidence intervals) for numeric and slider scale ratings of streaming entertainment services.
With a difference of only 0.6 and a fairly large sample size, this result was markedly nonsignificant (t(179) = 0.94, p = 0.35). The 95% confidence interval around the difference ranged from -0.7 to 2.0 so, with 95% confidence, a difference of 0 is plausible, but a difference exceeding 2.0 is not.
Summary and Takeaways
When collecting data in studies of user experience, it can be tempting to use sliders in place of more standard linear numeric scales. It just feels like they should provide a better indication of the feelings and attitudes of the people providing the ratings (there is a cool factor to them!).
However, findings from the literature and our recent study indicate that sliders do not provide any particular measurement advantage over the more widely used linear numeric scales, especially if the linear numeric scale has at least five response options.
This doesn’t mean you can’t use sliders in your research. But if you use sliders, you should be aware of their potential downsides relative to numeric scales. This includes their need for more physical space, the possibility for lower completion rates, and the greater difficulty of use for some populations (especially when the scale requires users to drag the slider to the desired position), all of which can be avoided by using standard linear numeric scales.
[Slightly updated 9/13/2020]


