Product Description
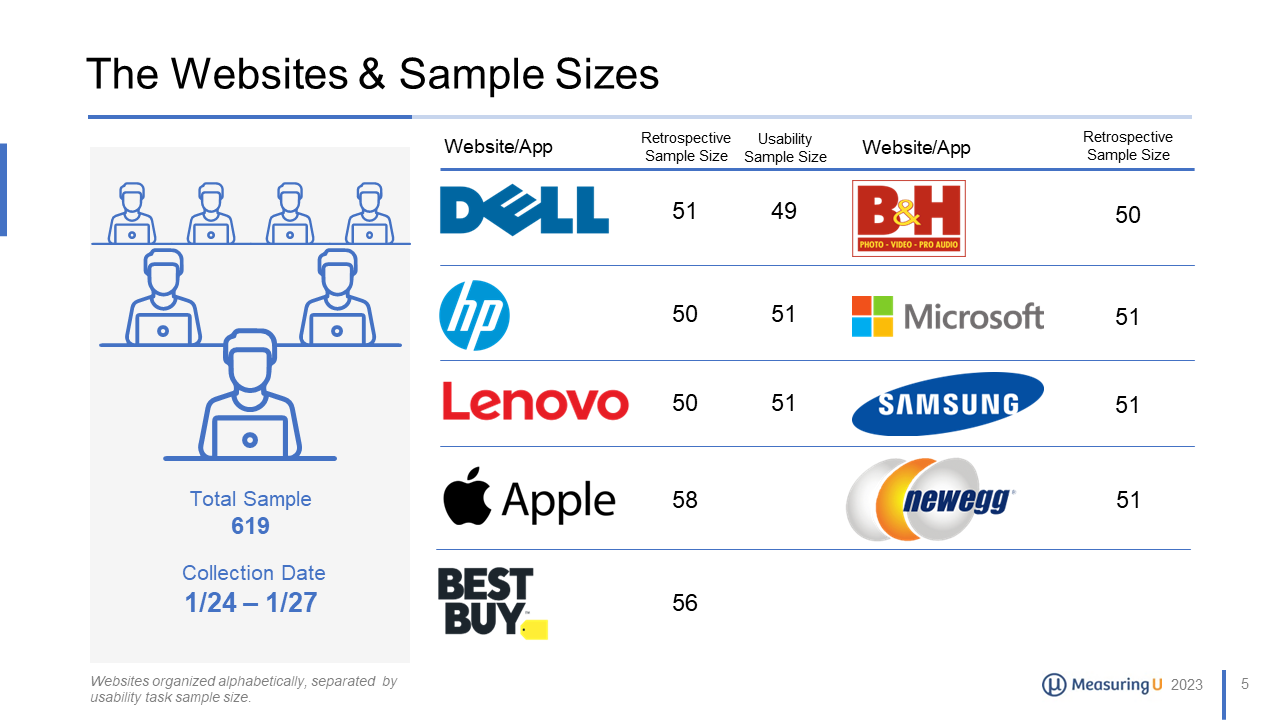
A retrospective (468) and task-based (151) analysis of 619 participants’ experiences using 9 popular consumer electronics websites: Apple, Best Buy, B&H, Dell, HP, Lenovo, Microsoft, Newegg, and Samsung.
This report contains UX benchmarks (SUPR-Q, Net Promoter Scores, and UX-Lite), Key Driver Analyses, and Areas of Improvement.
Table of Contents
- Executive Summary
- Study Design
- SUPR-Q & NPS
- SUS
- UX-Lite
- Website Brand Attitude
- Platform Use and Experience
- Likelihood for Continued Use
- Reported Purchases Made and Amounts
- Key Drivers of UX Quality
- Clutter Ratings
- Best & Worst
- Mobile Ratings
- Areas for Improvement
- Usability Study
- Appendix (Demographics)
Individual License: provides one person within an organization access to the license.
Site License: provides multiple people within the organization access to the license.


