
Every couple of years (or so) we assist our friends at the UXPA in helping the UX community understand the latest compensation, skills, and composition of the UX profession.
The UXPA salary survey didn’t go out in 2020 because of the impacts of the pandemic, but we’re happy to have a new set of data from 2022.
We again hosted the survey on our MUIQ platform and summarized the findings on salaries and related skills of UX professionals from around the world. The details are available on the UXPA website. Here are the highlights we discovered and the calculator.
Survey Results
- The data were collected from July 2021 to March 2022 using a non-probability sample. Initial respondents responded to postings on professional networks and websites, such as UXPA and LinkedIn. Additional respondents were recruited using snowball sampling. Keep this sampling approach in mind, as it impacts the generalizability of the findings and the comparability to earlier data.
- International reach, most from the U.S. The survey is based on 625 responses from 31 countries, with 72% of the responses coming from the U.S. Other significant numbers came from the UK (9%), Canada (5%), and Germany (2%). The sample size was around half of what we normally get, so we suspect there might be some survey fatigue from practitioners. Despite the smaller sample size, we saw very similar patterns compared to the 2018 data, suggesting consistent representative coverage.
- The median salary is $109K. This is 15% higher than the 2018 median of $95K. If you’ve been paying attention to the news and your credit card statement, you probably also noticed a significant amount of inflation. Unfortunately, that inflation deflates the buying power of salaries. As we’ve done in the past, we also converted the salaries into constant U.S. dollars. We used the inflation data from January 2021 (which is likely significantly less than inflation from 2022, but we need a full year’s data to make that adjustment). After accounting for inflation, the salary is 9% higher than our 2018 sample. But that year seemed to be a bit of an anomaly compared to earlier periods where the median salary in constant currency has fluctuated around $105K, suggesting little change in real salaries. Some of the fluctuation in salary can be attributed to different sample characteristics (e.g., more or fewer people responding from some countries).
What Factors Affect Salaries?
You can accurately determine your potential salary if you know the variables that most affect salaries. As we did in 2018, we conducted a key driver multiple regression analysis (on the log-transformed salaries) to see which variables statistically predict what people earn (Figure 1).
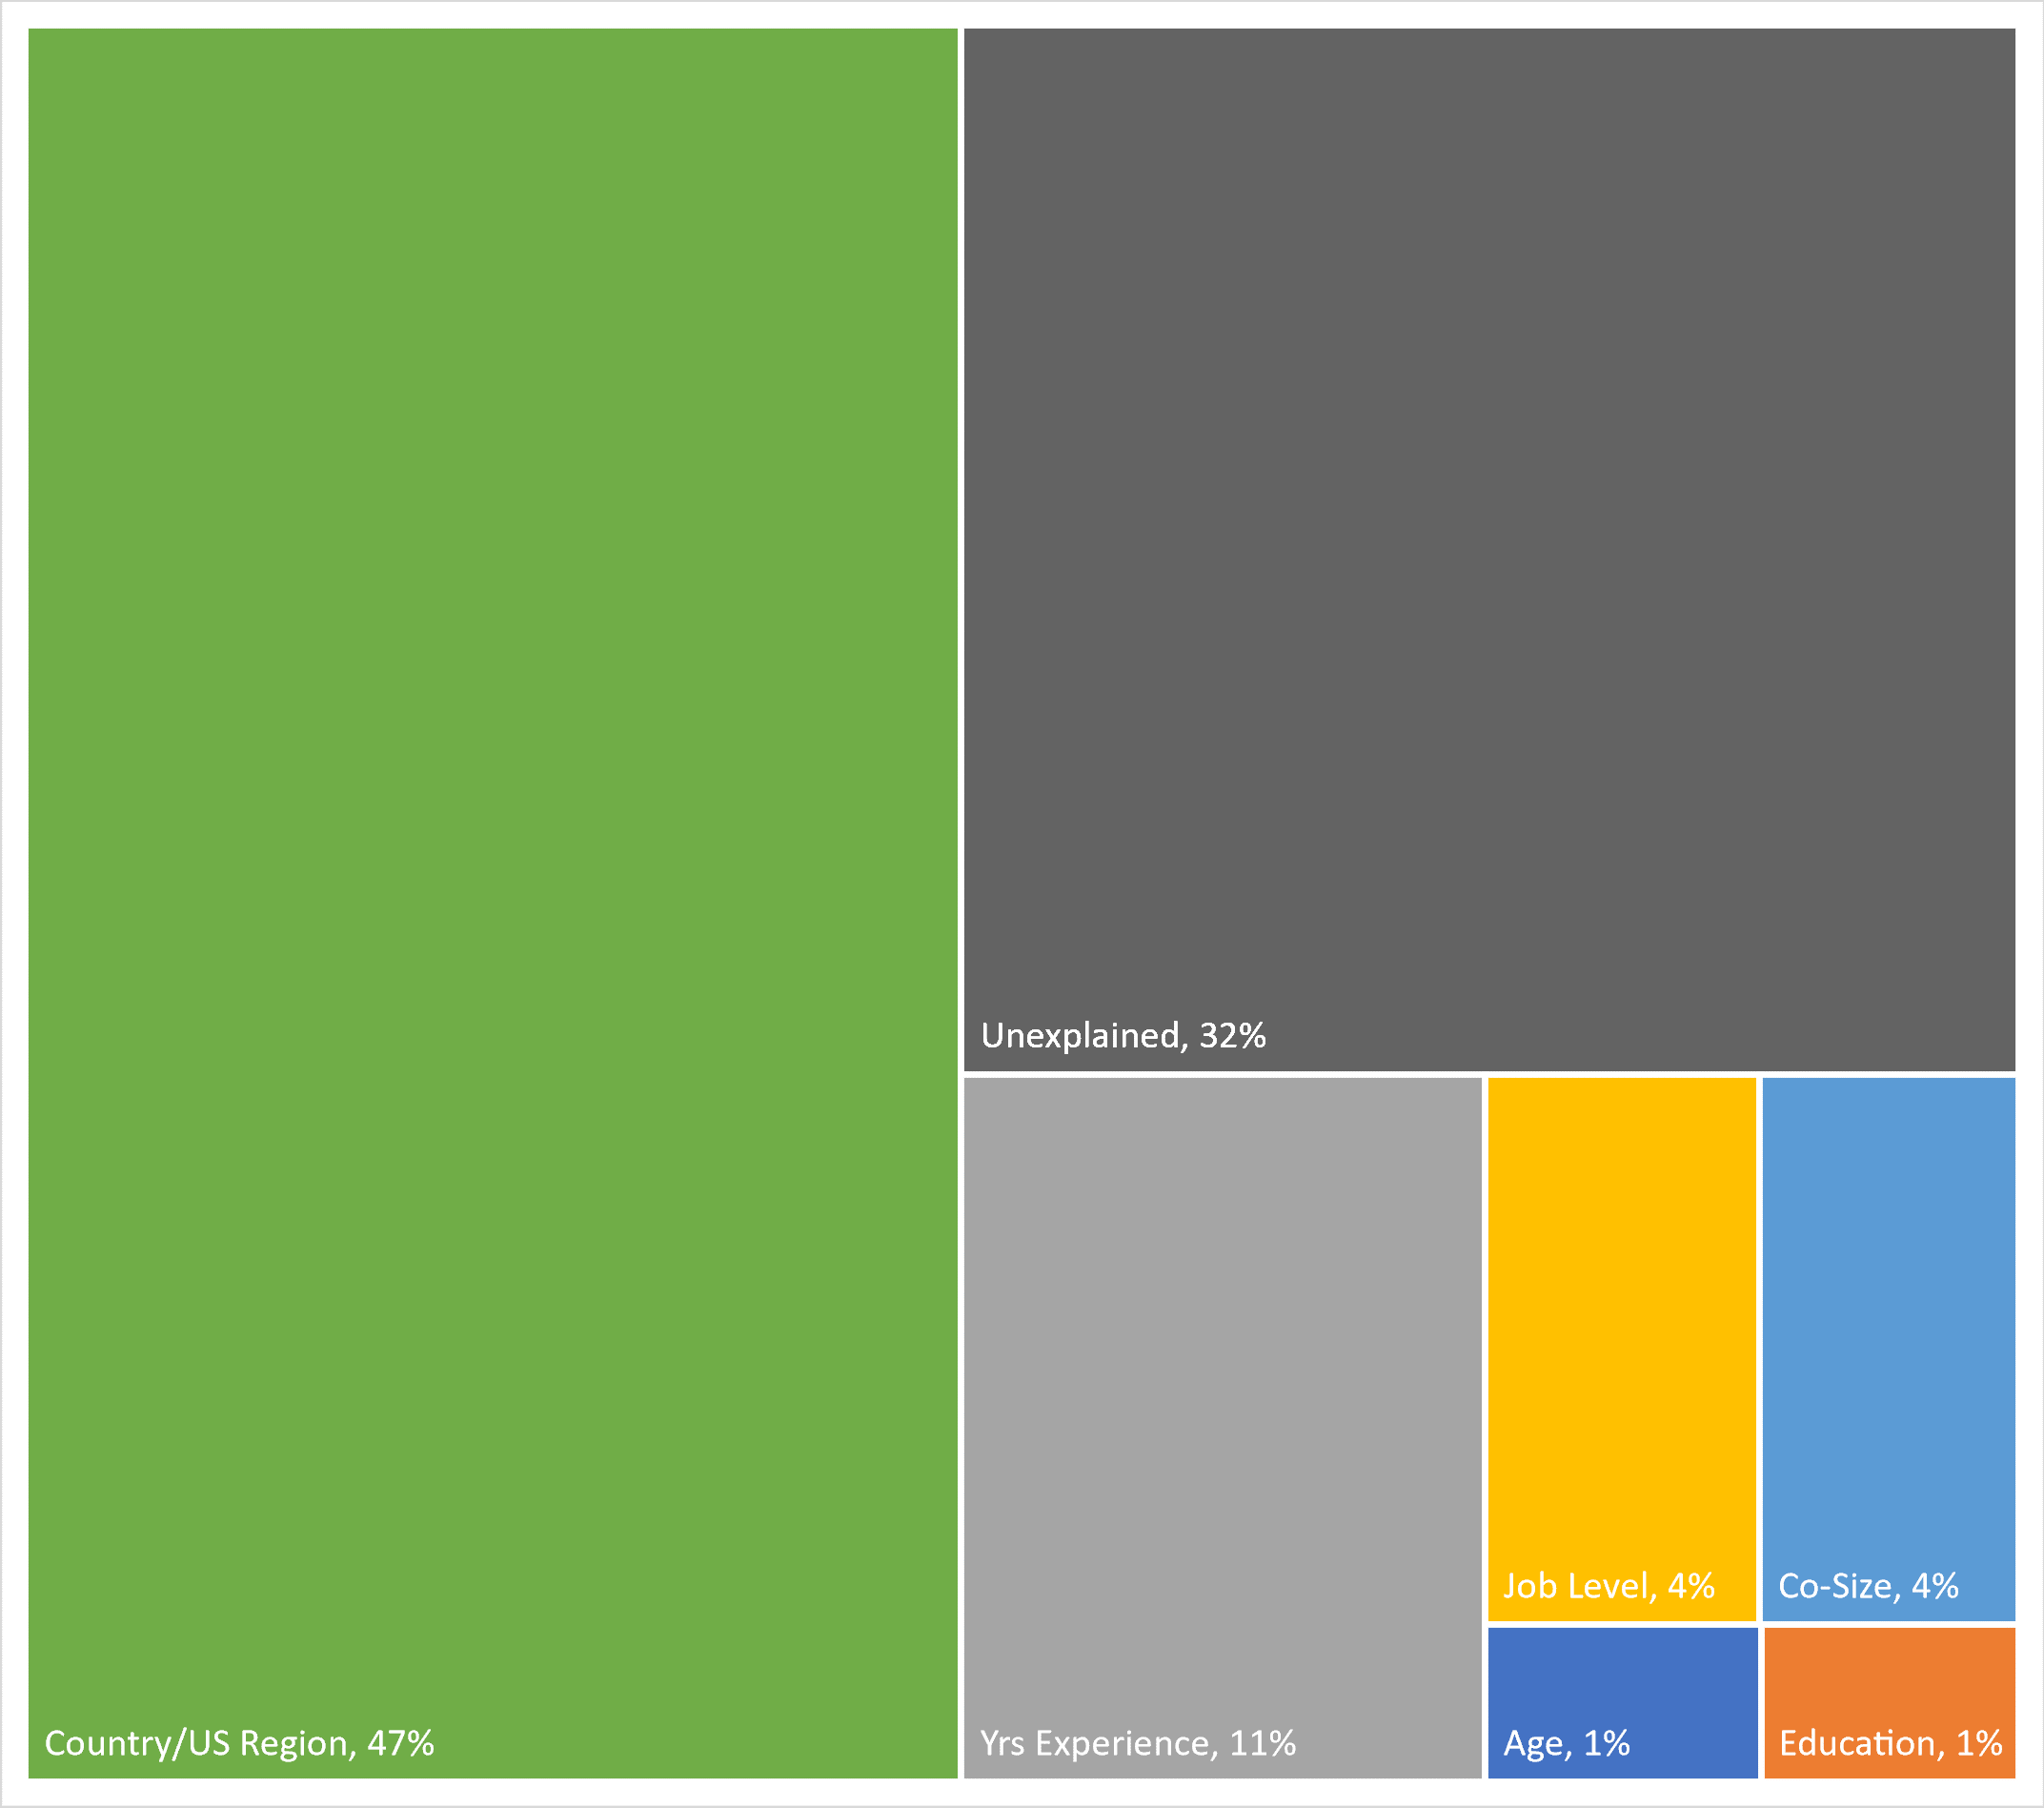
The regression equation predicted 68% of the variation in salaries. (The dark-gray section of the chart represents the variability in salary not accounted for by these predictors.) In the behavioral sciences, explaining 68% of variation is very good. Individual factors—skills, personalities, negotiation, company policies, etc.—also affect your salary; keep that in mind as you review the numbers and use the calculator below.
As in years past, these are the most influential factors for salaries in the UX field (in order of importance):
- Where you live: Country of residence (and region for the U.S.) has the biggest impact on what you get paid. This alone explains 47% of the variation in salary data. The median salary in the U.S. is $127K, compared to $79K in the UK, $76K in Canada, and $60K in Germany. All other countries had fewer than ten respondents.
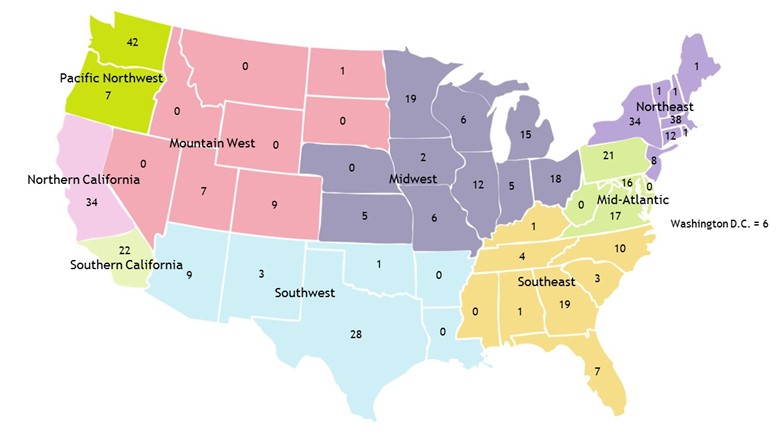
In the U.S., the highest salaries are in northern California ($179K), followed by the Pacific Northwest ($138K), edging out the Northeast ($137.5K), which had the second spot in 2018. The Southwest ($132K) and Southeast ($130K) rounded out the top five, pushing Southern California out of the top five compared to 2018.
While there was a lot of talk about employees working remotely in different regions (e.g., people from California living in Texas during the pandemic), the patterns we see have generally stayed the same. The map below shows the number of usable salaries we analyzed for each state and how we labeled the region.
- Experience: The more experience you have, the more you get paid. Experience accounts for 11% of salary variation.
- Job level: The next biggest driver of salaries is job level, accounting for just over 4% of the variation in salaries. Senior-level supervisors make, on average, almost twice what entry-level employees make ($140K vs. $75K).
- Company size/type: The bigger the company, the bigger the paycheck generally, and this variable accounted for 4% of the variation in salaries. It’s hard for small companies to compete with the big payroll of larger companies. Employees at companies with fewer than ten employees make a median of $65K compared to employees at larger firms (over 10,000 employees), who make on average $122K.
- Education: Your degree matters (somewhat). Around 11% of respondents reported having a Ph.D. (similar to but nominally higher than years past). Respondents with a Ph.D. make on average $122K compared to those with master’s degrees ($110K) or bachelor’s degrees ($105K). But these differences in degrees accounted for just over 1% of the variation in salary data (almost the same as in 2018).
- Age: Age had only a small statistical impact on salaries, accounting for just over 1% of salary variation. Just like in the 2018 data, there was only a small negative impact on salaries for the oldest AND youngest workers (18–25 and 56–65).
- Gender: This year, as in years past, there were no significant differences in reported salaries between men and women. Women make slightly more than men in 5 of 7 experience brackets and men make slightly more than women in 1 of 7 experience brackets (21+ years of experience).
Salary Calculator
To estimate your theoretical salary based on the 2022 data, enter your information in the calculator below. Only the variables that statistically affect salary are included. Taken together, these variables account for about 68% of the variation in salaries. We’ve also included a rough 95% confidence interval around the prediction to better illustrate the expected variability around each salary estimate.
Examples
- A 35-year-old, mid-level non-supervisor, with five years of experience, at a mid-sized company (1,500 employees), in the Southwest U.S., with a bachelor’s degree, has a predicted salary of $104,339 (with a 95% confidence interval from $62,355 to $174,593). The only person in the sample who met these criteria had a salary of $105,000—showing very good agreement between the predicted and actual values.
- A 42-year-old, senior-level non-supervisor, with twelve years of experience, at a large company (10,001+), in the mid-Atlantic, with a Ph.D., has a predicted salary of $145,071 (with a 95% confidence interval from $96,359 to $218,408). The only person in the sample who met these criteria had a salary of $160,000. The predicted value fell well within the range of the confidence interval (but the width of the interval shows how much uncertainty there is around predicting a salary).
- A 45-year-old, senior-level non-supervisor, with eleven years of experience, at a company with 500 employees, in the UK, with a master’s degree, has a predicted salary of $89,556 (with a 95% confidence interval from $60,125 to $133,394). The only person in the sample who met these criteria had a salary of $85,000 (showing reasonably good agreement).
Notes on Using
Like many activities in the behavioral sciences, predicting salaries is an inexact science. Other variables and individual differences substantially affect salaries. The predicted salaries are based on what UX professionals voluntarily reported making, so expect individual results to vary. Please contact us if you find a large discrepancy between your salary and the predicted salary.
- Salaries generated by this calculator are estimates around the median; you can expect variability above and below each estimate. The predicted median salary will be less accurate than a salary with a 95% confidence interval around it.
- The calculator estimates values even for combinations unlikely to exist (e.g., executives with two years of experience) so proceed with caution when computing “what-if” scenarios.
- There may be some variation in how respondents interpreted the salary question, which was, “What is your annual salary? (That is, your gross income before taxes) Please report your salary amount in your local currency (see the next question). Do not include commas or periods. Do not convert your salary to U.S. dollars.” For example, although the question asks for annual salary before taxes, it’s possible that a respondent might include a typical bonus in the amount. We expect any variation due to question interpretation to be more than covered by the confidence interval around our estimates.
")
")
