
Personas are a staple of UX research.
Some 70% of practitioners report using them.
Persona creation is typically a qualitative process using a small sample size.
Researchers conduct in-depth interviews and observations with small samples of participants (usually 5-20 people) in order to derive a rich and comprehensive profile of individuals that use, or could use, a product or service.
Personas get names, faces, and can take on a life of their own with details about pets, proclivities, and even personal hygiene.
Despite their popularity, personas are often criticized for lacking scientific rigor. Organizations often face these challenges when using personas:
- How many personas should there be: 3, 4, 6, or 8?
- Do personas actually improve the development process?
- Do personas really help deliver better user experiences and more successful products?
- Are the personas really generalizable beyond the small sample to the larger population of users?
- What details should be collected and displayed to developers?
- What variables differentiate the personas?
All too often these important decisions are made by intuition leading to serious questions about the credibility of personas as a research tool. We wanted to improve the process by increasing the generalizability of the findings using statistical methods while maintaining the rich data on tasks, goals, and motivations with quotes and stories that help product teams. We will also be presenting this process at UXPA in Toronto.
Six Components To Make Personas More Scientific
Our approach to personas is to use a mixed-methods approach that leverages the techniques from a segmentation analysis while maintaining the rich qualitative details that a traditional persona provides.
This approach provides the best of both worlds: detailed information that describes statistically reliable clusters that are also generalizable. It has six components:
- Conduct qualitative interviews and observations.
- Survey a large sample of users and/or prospects.
- Identify segments using a statistical clustering technique.
- Determine key variables that differentiate segments.
- Predict segment membership using a typing tool.
- Personify or qualify your segments.
With a mixed-methods approach, you can alternate the order in which you conduct the qualitative interviews, and collect and analyze the quantitative data (steps 1 and 2).
For an exploratory approach (if you’re unsure of what questions to ask and have little idea about who your personas might be) start with the qualitative interviews, to inform your survey questions.
For an explanatory approach (if you have a good idea about the variables but want more detailed information), start with the quantitative survey and follow up with the qualitative component.
By combining data from large-scale surveys and qualitative investigations, it’s possible to develop personas that are satisfactorily nuanced, as well as are generalizable.
Here are more details on each of the six components. We used this process to help a U.S.-based national retailer validate its personas for an online grocery delivery service and will reference the results throughout.
1. Conduct qualitative interviews and observation.
Through careful observation and inquiry, identify challenges, problems, attitudes, and behaviors that characterize and differentiate groups of users. The number of participants you interview and observe is a function of how common the behaviors and attitudes you observe are. Here is a primer on conducting qualitative research. For the grocery study, the team had already conducted extensive interviews and observations and synthesized the findings into four personas they wanted to validate.
2. Survey a large sample of users or prospects.
Qualitative data isn’t intended to be generalizable and with smaller samples you’re limited to seeing big differences between people and personas. The survey should include questions that address the key variables and hypotheses you’ve identified from the qualitative interviews (or from your personas if you’ve already defined them).
While this survey inevitably includes demographic questions, don’t plan to rely on attributes like age and gender to differentiate your segments. Instead think about how to ask questions that get at motivations, frustrations, and behaviors to understand the reason customers “hire” your interface and how that might differ across certain classes of users.
You’ll also want to recruit potential participants in this survey for future qualitative follow-ups. The clustering techniques used to identify the segments and personas require a large sample size (min 100; ideally 500+) to define stable groups. For the online grocery study we recruited a sample size of 3000 participants using existing customer lists and external panels. The survey lasted about 15 minutes and included 75 questions about online shopping attitudes and behaviors.
3. Identify the segments.
With the data collected from your large sample survey, identify patterns in the responses. There are a number of statistical techniques to identify segments. We used a technique called latent class analysis (LCA) to identify the hidden groups. LCA is similar to other clustering techniques that group variables based on the correlation between responses, but it’s better suited to handle the categorical data you get from this type of survey.
Like factor analysis, the process is iterative as you start with a number of segments (called classes), often four or five. Through the process you increase or decrease the number of classes and retain the variables you think differentiate groups to see the story the data tell about what groups exist.
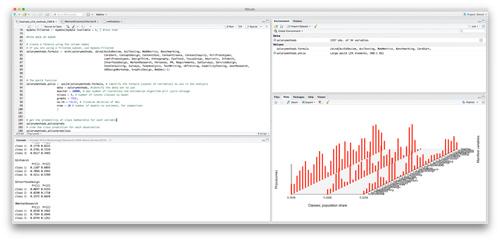
Figure 1: Typical LCA output in R.
The number you settle on is a combination of finding the best statistical fit and something that matches your theories of what differentiates the segments. For example, we suspected variables like whether participants had kids or were budget conscious would differentiate the respondents. After the iterative process we identified four classes using twelve variables.
Working with advanced statistical techniques requires both specialized software and training in reading output such as fit statistics and watching for methodological pitfalls. It’s not for the faint of heart. We’d be happy to conduct the analysis for you or find a qualified statistician who can help.
4. Determine key variables that differentiate segments.
Through the process of identifying clusters in your data, some variables will emerge as more important in differentiating segments than others (we started with dozens of variables and retained twelve). To better understand which variable combination best predicts the class membership, we used a complementary technique called discriminant analysis. It’s a similar idea behind predicting political party affiliation (and who people will vote for) by asking a few, less specific questions.
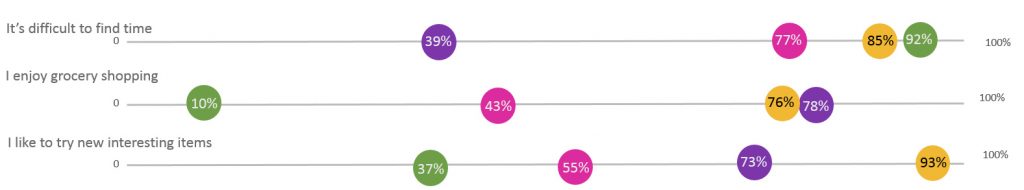 Figure 2: Example variables that differentiate the segments.
For example, variables differentiate people who closely align with the Democratic party versus the Republication party, such as attitudes toward equality, liberty, and the role of the federal government. A discriminant analysis identifies which key questions (or statements) really differentiate groups and predict attitudes and behaviors. The outcome of the discriminant analysis is the right combination of a small set of variables (questions, statements, or characteristics) that best predict which segment people belong to.
5. Predict segment membership using a typing tool.
With the right variables identified, you can then create a “typing tool” that will predict which segment new respondents best belong to. This typing tool (which is delivered as an Excel file or set of formulas) can be used to help with recruiting for usability studies, surveys, or product marketing and selling.
In the segmentation analysis for the grocery study, the typing tool identified a weighted combination of nine variables that the national retailer can use to proportionally recruit for field observation and usability studies. That’s a small fraction of the dozens of variables we started with.
6. Personify or qualify your segments.
Depending on whether you’re taking a more exploratory approach or explanatory approach you will either personify or qualify your segments.
Personify
If you’re creating personas with this method you likely won’t have much, if any, qualitative data from interviews and observations. In other words, the details that bring personas to life are missing. You’ll essentially want to do the first component (conduct qualitative interviews and observations), except you now base your sample on the segments you’ve identified and use the key variables identified to know what to focus on.
You can even recruit the participants from your larger-scale survey and dig deeper into motivations behind responses. We took this approach when building personas for a separate online real-estate website. We conducted in-depth interviews with 20 participants across the different segments that provided rich quotes, names, and stories that were as real as the segments they personified.
Qualify
If you’re using this process to validate your personas you likely already have the rich qualitative data, including quotes from actual individuals. This will help determine if you’ve identified the right number of personas and variables. It also tells you whether a persona represents say 10% or 50% of the target population—something qualitative data cannot provide. It can also help provide additional meaning to comments you heard in the qualitative data.

Figure 3: Example sections of a qualified persona.
In the grocery study, there was indeed overlap with what was identified from the qualitative study because it was heavily used to guide the quantitative analysis. Our final model had four segments that had a close match to the four existing personas. But there were also some surprises and new insights. For example, participants made comments about how they hated grocery shopping. The quantitative analysis revealed that one of the key drivers of this group’s hate for grocery shopping was the lack of time and not the actually shopping itself.
Summary
Personas are a popular technique used to make informed decisions around design. They have primarily been derived using small-sample qualitative methods. They are often criticized for lacking scientific rigor and common concerns include identifying the right number of personas and determining which details actually matter. By adding a larger quantitative survey component and using statistical clustering techniques to identify the right number of personas and the variables that differentiate them, you can have the best of both worlds: rich qualitative insights and generalizable findings.

