 When we think of how the internet has changed commerce, we often consider our ability to browse and purchase products from around the world easily from the comfort of our homes with our mobile phones.
But the internet has also enabled millions of people to easily sell their products to global consumers. That selling often takes place on online marketplaces such as eBay and Etsy, which bring together sellers and buyers for a cut of their transactions. These cuts now reach into the billions of dollars.
For example, the 2020 revenue for eBay was 10 billion dollars and for Etsy was 1.7 billion dollars. Seller marketplaces differ from a traditional retail experience in that experience of browsing and purchasing is provided by a mix of individual sellers and the company providing the platform.
A negative buying experience, say with a defective or fraudulent product, will impact attitudes not just towards the seller but also towards the marketplace platform that features them. So, while these marketplaces can make money from seller and buyer fees, they also face criticism from both sides.
In our earlier benchmarks of marketplaces, we focused exclusively on the buyer side, and we found that some marketplaces had low trust scores stemming from poor buying experiences and how they handled problems. In this benchmark, we focus on the seller side (keeping in mind that most sellers are also buyers).
Sellers often have to deal with complicated fee structures, delayed payments, and return policies that favor buyers, leading to potentially negative attitudes.
To better understand the seller experience on marketplaces (including aspects of their buying experience), we benchmarked the user experience of the following websites to see how people use them and how they might be improved:
We collected SUPR-Q® and Net Promoter data, investigated reasons for using the websites, measured users’ attitudes regarding their experiences, conducted key driver analyses, conducted a light heuristic evaluation, and analyzed reported usability problems.
Benchmark Study Details
In August and October 2021, 307 respondents (U.S. residents) participated in a retrospective study in which we asked people who had used at least one seller marketplace website in the past year to reflect on their experiences. The Venn diagram in Figure 1 shows the distribution of sellers and buyers in our sample, illustrating the focus on sellers.

Participants completed the eight-item SUPR-Q (which includes the Net Promoter Score), answered the UMUX-Lite standardized questionnaire, and answered questions about brand attitudes, usage, and their prior experiences.
Quality of the Seller Marketplace Website User Experience: SUPR-Q
The SUPR-Q is a standardized measure of the quality of a website’s user experience and is a good way to gauge users’ attitudes. It’s based on a rolling database of around 200 websites across dozens of industries, including seller marketplaces.
SUPR-Q scores are percentile ranks that tell you how a website experience ranks relative to the other websites (so the 50th percentile is average). The SUPR-Q provides an overall score as well as detailed scores for subdimensions of usability, trust, appearance, and loyalty.
The six seller marketplace websites averaged at the 48th percentile. Craigslist had the lowest SUPR-Q (14th percentile), and Etsy had the highest (71st percentile).
Usability Scores and Trust
We asked participants to reflect on how easy it was to use and navigate through the websites. Facebook Marketplace and eBay had the highest usability scores (85th and 83rd percentiles), and craigslist had the lowest (43rd percentile). Comments about craigslist usability included
“It’s pretty outdated and it would be nice to have easier ways to find, filter, and categorize items.”
Most sites had trust scores between the 20th and 30th percentiles. The lowest trust scores were for craigslist (2nd percentile) and Facebook Marketplace (7th percentile). Examples of verbatim comments for these low-trust companies included
“The bots and scammers that contact you through your postings are very frustrating” (craigslist) and “There have been times fake or inaccurate items are sold on the marketplace.” (Facebook Marketplace).
More verbatim comments are available in the downloadable report.
Loyalty/Net Promoter Scores
The average NPS for the seller marketplace websites was 18%, with all scoring positive (more promoters than detractors) except craigslist (−8%). In general, a better user experience is a good predictor of higher loyalty.
Use of Seller Marketplace Sites and Mobile Apps
As a part of this benchmark, we asked participants how they accessed online seller marketplace services. All participants reported using their desktop/laptop computers (this was a requirement for participation in the survey), with 79% also using mobile apps and 68% using mobile websites. The typical frequency of use was a few times a month for websites and a few times a week for mobile apps.
Components of the Seller Marketplace Website Experience
Across the websites, using a series of five-point scales (see Key Drivers), we computed the top-two-box percentages of items that rate components of the seller marketplace website experience. Overall, 88% of participants agreed that product images were clear, and 86% indicated the sites were easy to navigate. Among the low ratings, only 50% thought the sponsored ads were relevant, and only 57% reported a personalized shopping experience.
Key Drivers
To better understand what affects SUPR-Q scores and Likelihood-to-Recommend (LTR) ratings, we asked respondents to agree/disagree with the following attributes of the seller marketplace websites on a five-point scale from 1 = strongly disagree to 5 = strongly agree. We conducted key driver analyses (using multiple regression modeling and Shapley value regression) to quantify the extent to which ratings on these items drive (account for) variation in overall SUPR-Q scores and, separately, LTR (the rating from which NPS is derived).
- The search results are relevant
- I can find inspiration for products I might want on the website
- I am confident that I would be paid for the item if I were to ship it
- I trust the condition of products that are noted on the site
- It’s easy to see exactly how much I’ll be charged
- Ratings for sellers are important to me
- I can easily find deals and discounts
- It’s easy to find exactly what I want
- Shipping costs are clear
- I am comfortable communicating with buyers and sellers on the website
- It’s easy to find ratings/reviews for buyers
- It is easy to communicate with buyers or sellers on the website
- The checkout process is smooth
- I am confident that I will receive the item that I paid for
- It’s faster than going to a brick-and-mortar store
- It’s easy to find ratings/reviews for sellers
- I can quickly find the brands I want
- Ratings for buyers are important to me
- It’s easy to find item specifications
- It’s easy to find sizes and colors I’m interested in
- Product descriptions are clear
- I can easily find ratings/reviews for products I’m interested in
- Product images are clear
Key Drivers Include Ease of Finding What You Want and Comfort Communicating with Buyers/Sellers
SUPR-Q Drivers. The top key driver from the list above was “It’s easy to find exactly what I want” (accounting for 12% of SUPR-Q variation). Top-two-box scores of this driver ranged from 48–80%. Other significant key drivers included relevant search results and ease/comfort of communicating with buyers and sellers on the website.
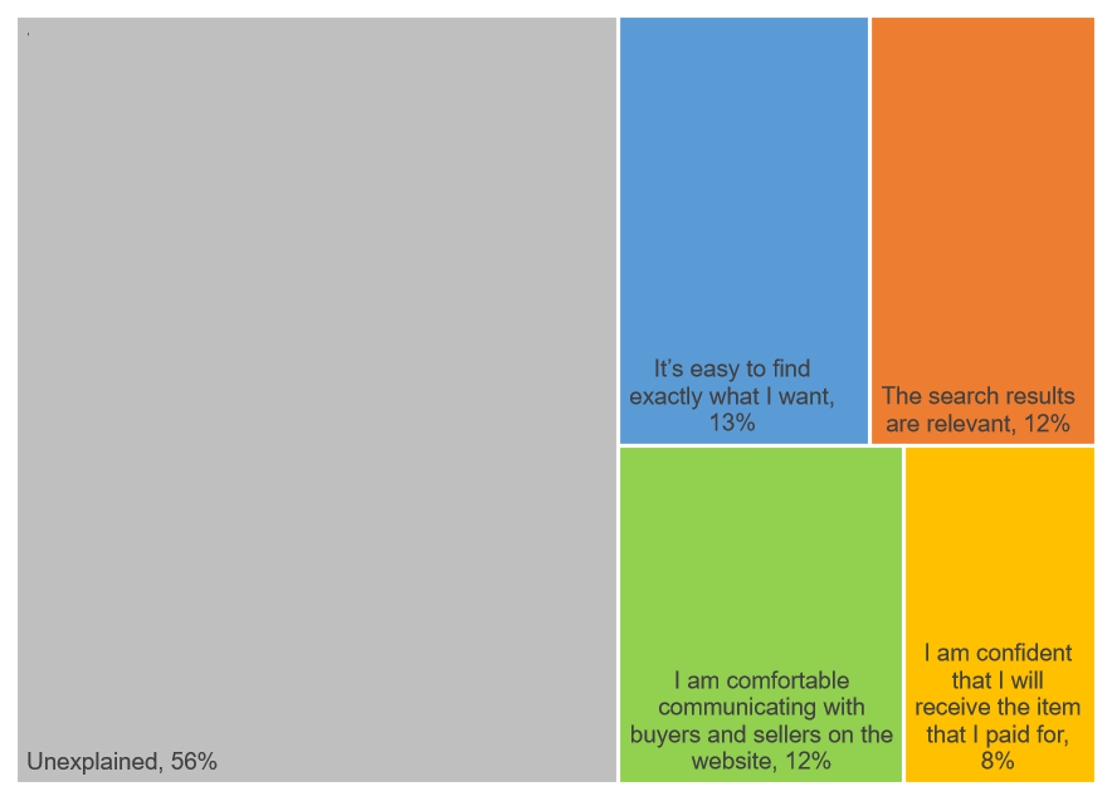
LTR Drivers. Four items in the attribute list accounted for significant amounts of variation in the ratings of likelihood-to-recommend (which is the measure from which the NPS is derived). Consistent with the SUPR-Q results, “It’s easy to find exactly what I want” (13%) was the top driver in this analysis (see Figure 2).
What to Improve: Verbatims
Key areas of improvement cited by respondents for each website/app include
- craigslist: Trust (e.g., “Fake posts are an inconvenience, as well as scammers…”)
- eBay: Appearance (e.g., “It is kind of bland. It’s not that appealing to the eye.”)
- Etsy: Business Model (e.g., “The amount that Etsy charges for sellers, it becomes very difficult and Etsy is going to a place where only the well-known and successful on Etsy will continue to do well.”)
- Facebook Marketplace: Trust (e.g., “Never had any big problem, but it is very easy to get tricked.”)
- OfferUp: Trust (e.g., “One of the main problems/frustrations I have had with the OfferUp website are the scammers.”)
- Poshmark: Appearance (e.g., “Very unattractive and dull looking.”)
Although not necessarily the most frequent issue for all websites, numerous comments were related to trust and appearance.
What to Improve: Heuristic Evaluation
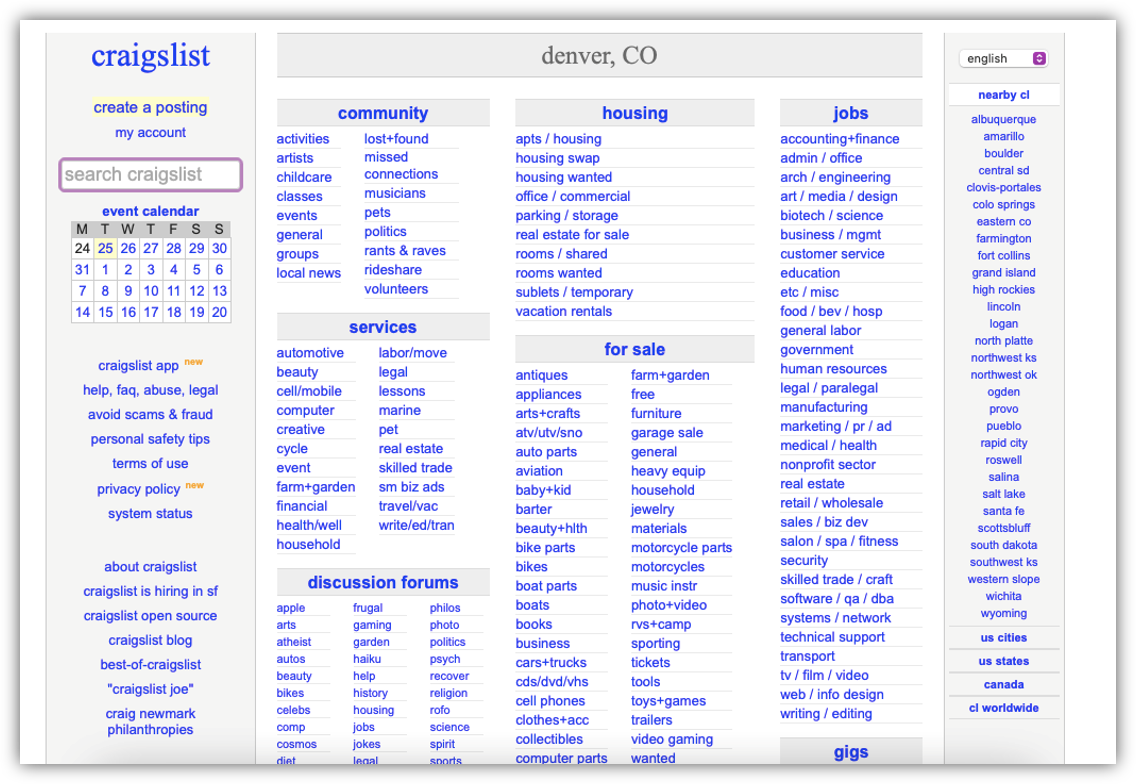
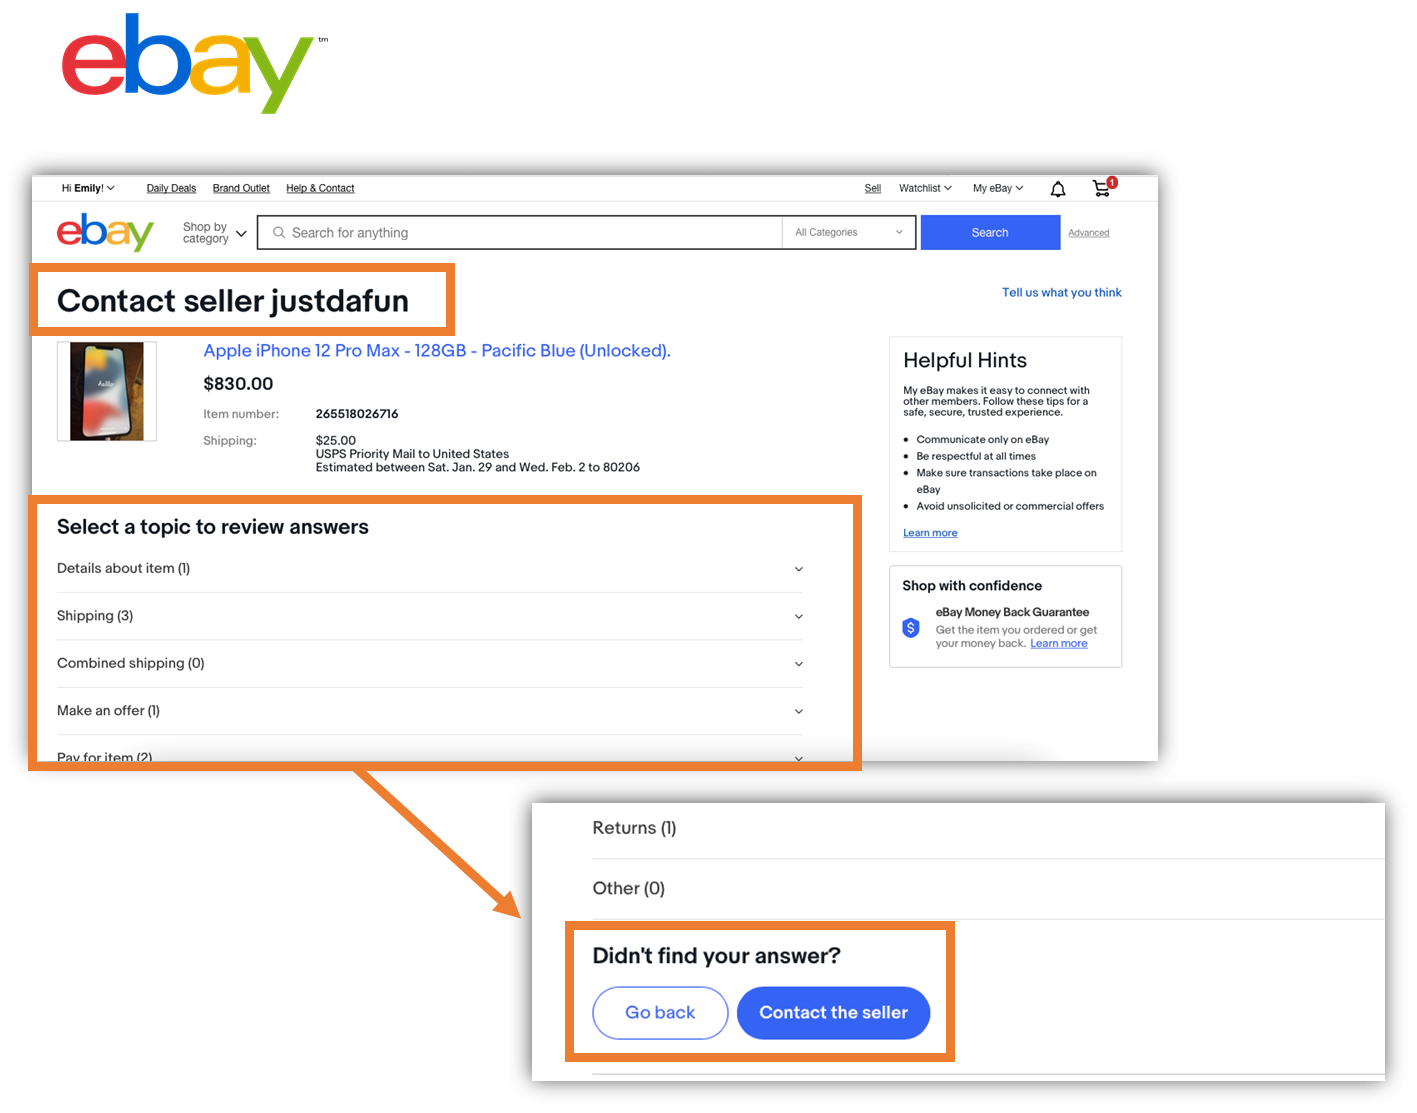
The heuristic evaluation highlighted issues with browsing on the websites. Browsing can be difficult on the seller marketplace websites because of the overwhelming number of items and lack of good filtering (e.g., Figure 3). Despite one of the key drivers being “comfortable communicating with buyers and sellers on the website,” some websites make this important function difficult to find (e.g., Figure 4).
Comparison with Results from the 2015 SUPR-Q Survey
In 2015, we collected SUPR-Q and NPS data for craigslist, eBay, and Etsy. From 2015 to 2021, NPS for all three websites declined. The largest shift in the NPS was for craigslist, which dropped substantially from 34% to −8%.
Consistent with the NPS, all three websites suffered drops in SUPR-Q scores. The smallest decline (from 44% in 2015 to 42% in 2021) was for Etsy.
Full details are available in the downloadable report.
Summary and Takeaways
An analysis of the user experience of six seller marketplace websites found several key takeaways:
- Trust in craigslist and Facebook Marketplace was very low. SUPR-Q Trust scores for these two websites were very low (2% for craigslist, 7% for Facebook Marketplace), dragging down their overall SUPR-Q scores to 14% for craigslist and 50% for Facebook Marketplace.
- Most respondents had both buying and selling experience. Although we primarily targeted buyers in our sample, 84% of respondents were both buyers and sellers on the website they rated.
- The ease of finding desired items drove SUPR-Q and LTR scores. “It’s easy to find exactly what I want” was the top key driver for both SUPR-Q and NPS. Other drivers of both outcome metrics were comfortable communications between buyers and sellers on the website, confidence in receiving the item paid for, and relevant search results.
- SUPR-Q and the NPS varied substantially. The websites had SUPR-Q scores ranging from the 14th to the 71st percentiles (a mean 48th percentile where the 50th percentile is the average for all websites in our current normative database). The average NPS across the websites was 18%.
- Mobile app usage was relatively high. The typical frequency of use was a few times a month for websites and a few times a week for mobile apps (the most frequently used mobile app was Facebook Marketplace). Overall, 79% of respondents reported using mobile apps, and 68% reported using mobile websites.
Full details are available in the downloadable report.


