There are a lot of opinions about the best formats for agreement scales. Sometimes those opinions are strongly held and can lead to lengthy, heated discussions within research teams. When format differences affect measurement properties, those discussions may be time well spent, but when the formats don’t matter (or matter very little), the time is wasted.
That’s why we have an ongoing research goal to explore this subject, to find the differences that matter and those that don’t, at least in the context of UX research.
In pursuit of this goal, we’ve recently reported comparisons of UMUX-Lite data collected with standard five-point linear numeric scales and slider scales, five-star ratings, and face emoji scales.
Despite major differences in the scale formats, after converting the numeric scale data to the 0–100-point scale that’s standard for the UMUX-Lite, the mean differences between the standard and alternate scales were 0.7 for sliders, 1.3 for stars, and 0.5 for face emojis. None of these differences were statistically significant.
We no longer expect to find big differences in UX measurements when the only manipulation is to item formats. Then again, reality doesn’t care about our expectations, so from time to time, we research different formats. Having data is a great way to get your expectations to align with reality.
Continuing this line of research, we recently collected a set of data for the comparison of standard five-point linear numeric scales (1 to 5) and alternative five-point negative-to-positive (Neg2Pos) scales with 0 at the center (-2 to +2).
What Are Neg2Pos Scales?
UX researchers often collect subjective data with agreement scales, and one of the most common formats is the linear numeric scale with endpoint labels and numbered response options starting with 1 on the left. This format is popular for standardized UX questionnaires, including the System Usability Scale (SUS), SUPR-Q, and UMUX-Lite.
A slightly less common approach is to assign the center response option as 0, with negative numbers to the left and positive numbers to the right. There is no standard name for this format, so we refer to it as a negative-to-positive (Neg2Pos) scale. Figures 1 and 2 show examples of the five-option standard linear numeric and Neg2Pos versions of the UMUX-Lite.
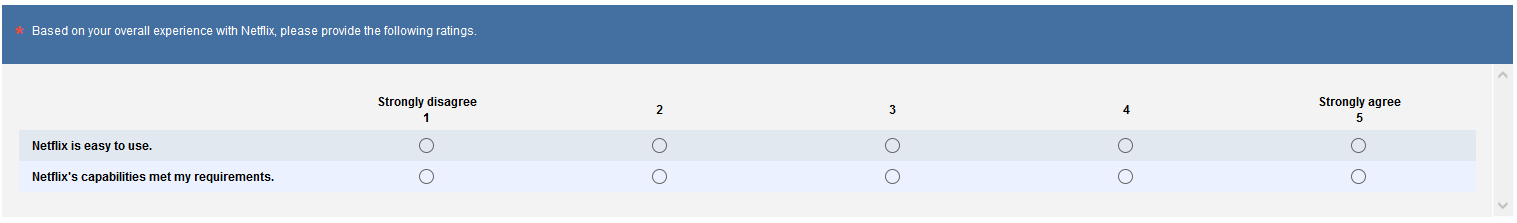
Figure 1: Example of a standard linear numeric version of the UMUX-Lite (created with MUIQ).
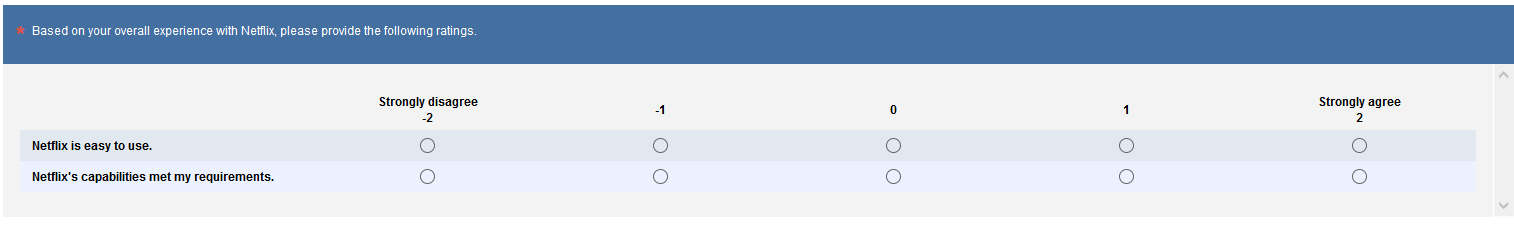
Figure 2: Example of the UMUX-Lite using a five-point Neg2Pos scale (created with MUIQ).
The literature comparing Neg2Pos scales with standard linear numeric scales is sparse and mixed. In a recent review of item formats, DeCastellarnau (2018) cited just two relevant research papers: one reported differences in response distributions between standard and Neg2Pos scales, and the other reported no differences.
In the first one (Schwarz et al., 1991 [PDF]), respondents in face-to-face interviews were asked to rate how successful they had been in life so far, using an eleven-point scale represented as a ladder with “not at all successful” at the bottom and “extremely successful” at the top. Each scale step also had a number assigned to it, with half of the 1,032 respondents seeing 0 to 10 and the other half seeing -5 to +5. The response distributions were significantly different; 34% selecting from the bottom half of the ladder with the first version (0 to 5), but only 13% choosing from the bottom half of the ladder with the second version (-5 to 0). This led to a significant difference in means, with 6.4 for the first version and 7.3 for the second. (If converted to 0–100-point scales, that would be a mean difference of 9 points.)
In the second paper cited by DeCastellarnau, Reips (2000 [PDF—see pp. 95–104]) studied various context effects in web surveys (n = 292). Respondents provided ratings to the question, “Overall, how satisfied are you with the quality of your connection to the Internet?” None of the experimental manipulations—scale type, reading directionality, cursor entry position, question order, or type of numerical labeling—had significant effects on resulting measurements.
These experiments had widely different outcomes, but they also had widely different contexts. In Schwarz et al., respondents chose their response option in a face-to-face setting where the question had to do with their feelings of success in life. In Reips, respondents completed a short web survey about satisfaction with their Internet connection. It’s plausible that in the first context, respondents were reluctant to assign their life success a negative number, and in the second context, respondents were perfectly willing to assign negative numbers to their satisfaction with their Internet connection.
Based on the limited research, we would expect UX ratings with both numeric formats to produce similar outcomes. To check, we ran an experiment to see whether these format differences affected measurements made with a short standardized UX questionnaire, the UMUX-Lite.
Standard versus Neg2Pos Numeric Scales Experiment
We set up a Greco-Latin experimental design to support a within-subjects comparison of UMUX-Lite ratings of a variety of streaming entertainment approach. A total of 256 participants, sampled in August 2020 from a U.S. panel agency, rated one of Netflix, AT&T TV Now, Amazon Prime Video, Hulu, YouTube TV, or Disney+. (For detailed information about UX metrics and comparisons among popular video streaming entertainment websites and apps, see our recent article and report.)
In this design, there were three independent variables:
- Item Format (standard numeric, Neg2Pos—see Figures 1 and 2)
- Rating Context (rating of most recent experience with the service; rating of the overall experience with the service)
- Order of Presentation (standard/recent then Neg2Pos/overall; standard/overall then Neg2Pos/recent; Neg2Pos/recent then standard/overall; Neg2Pos/overall then standard/recent)
Participants were randomly assigned to one of the four orders formed by the crossing of Item Format, Rating Context, and Order of Presentation. Across the experiment, this controls for the “nuisance” variables of Rating Context and Order of Presentation. (In addition to the experiments we conduct for ourselves, we also use this study design for client projects when we need to efficiently control nuisance variables and want the enhanced precision of a within-subjects design.)
Results
We combined and converted the five-point responses for both versions of the UMUX-Lite to their standard 0–100-point scale and collapsed the data across the services. The mean difference (n = 256) was less than a point (0.7) and not statistically significant (Figure 3).
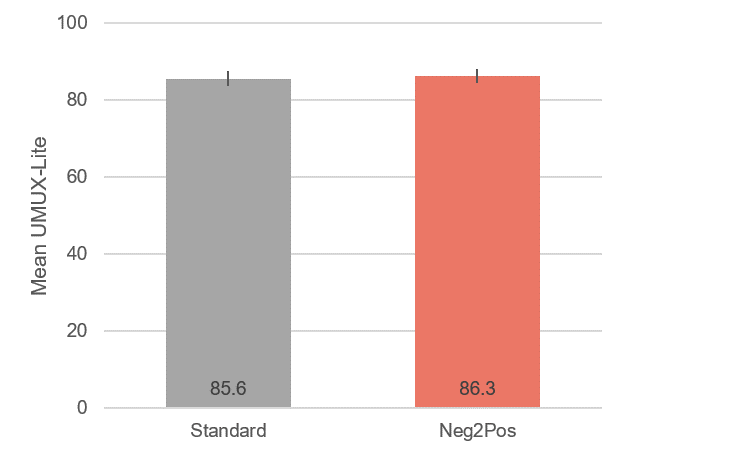
Figure 3: Overall difference between UMUX-Lite means for standard and Neg2Pos numeric scales (error bars are 95% confidence intervals with a margin of error of ±1.9).
An ANOVA indicated no significant main effects or interactions (all p > .22 with 252 error df). Because the main effect of order was not significant (F(1, 252) = 1.5; p = .21), there is no compelling evidence of asymmetric transfer distorting the ratings.
A 95% confidence interval around the observed difference of 0.7 ranged from -0.5 to 1.9, so a difference of 0 is plausible, but any absolute difference exceeding 1.9 isn’t plausible. There is no external benchmark for determining which of the means is “correct,” but the confidence interval shows that all plausible differences are small given the full range of the UMUX-Lite (0 to 100 points).
Figures 4 and 5 show the distribution of responses for the Ease and Usefulness (“meets requirements”) items of the UMUX-Lite for both formats (mapping the -2 to +2 response options to 1 to 5 for these graphs). As expected, the distributions were similar.
Note that these results are specific to these types of questions about one type of experience (streaming services). We would expect the results to generalize to similar item formats in similar contexts, but it’s always possible that there might be nonlinear scales with extreme enough deviation from linearity to affect the distribution of response options. For example, manipulating the wording of items in the System Usability Scale doesn’t have a strong effect on the resulting measurements unless the item manipulation is extreme (e.g., changing Item 10 from “I needed to learn a lot of things before I could get going with the system” to “I think that I would need a permanent hotline to the help desk to be able to use the website”). The effects of such extreme wording remain an open research question.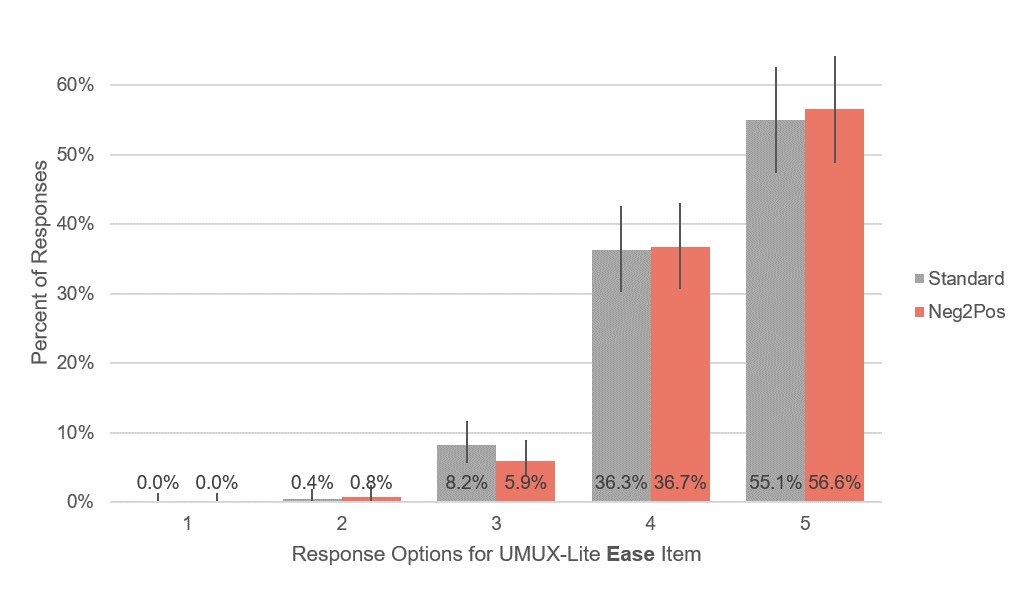
Figure 4: Response distributions for the Ease item (with 90% confidence intervals).

Figure 5: Response distributions for the Usefulness item (with 90% confidence intervals).
Summary and Takeaways
In this experiment, we found no significant differences or interactions between mean UMUX-Lite ratings collected with standard linear numeric scales (1 to 5) and Neg2Pos (-2 to +2) scales.
The overall observed difference (0.7) was consistent with the differences we found in similar experiments comparing linear numeric with slider scales (0.6), star scales (1.3), and face emoji scales (0.5). This difference is quite small relative to the full range of the UMUX-Lite (0 to 100 points).
A 95% confidence interval around the observed difference ranged from -0.5 to 1.9 points, so a true difference of 0 is plausible, but any absolute difference exceeding 1.9 is not.
The distribution of responses to the different versions of the Ease and Usefulness items differed little.
These results support the use of either format in UX research for the measurement of sentiments or attitudes about products or services. Because there doesn’t appear to be any particular advantage in using Neg2Pos scales in that context, UX researchers should feel comfortable with standard linear numeric rating scales. If they’re required to use Neg2Pos scales, they should do so with confidence given their demonstrated format equivalency.
Researchers should, however, be cautious using Neg2Pos scales when having participants rate themselves (e.g., success in life as in Schwartz et al., 1991), because it’s plausible that people may be reluctant to assign themselves negative numbers. For that type of research, unless there is a compelling reason to use scales with 0 at the center, it seems prudent to use more standard scales.


