 The System Usability Scale (SUS) is the most widely used questionnaire for measuring the perception of usability.
It’s been around for more than 30 years. While its original term “system” has fallen somewhat out of favor, its usage has not—with thousands of citations in the literature.
The system can be anything from business software, consumer software, websites, mobile apps, or hardware.
With such wide usage across industry and academia, there has been a lot of research into the SUS and many practitioners may not be familiar with some of it. Here are four recent advances with the System Usability Scale.
1. Drop the Learnability factor
While SUS was designed to be unidimensional (measuring only the construct on perceived usability), there was some evidence it measured more than one thing (multidimensional). In 2009, Jim Lewis and I published a paper using independent datasets that showed the SUS had a second factor. We called it the learnability factor from items 4 and 10 based on their wording:
- I think that I would need the support of a technical person to be able to use this system.
- I would imagine that most people would learn to use this system very quickly.
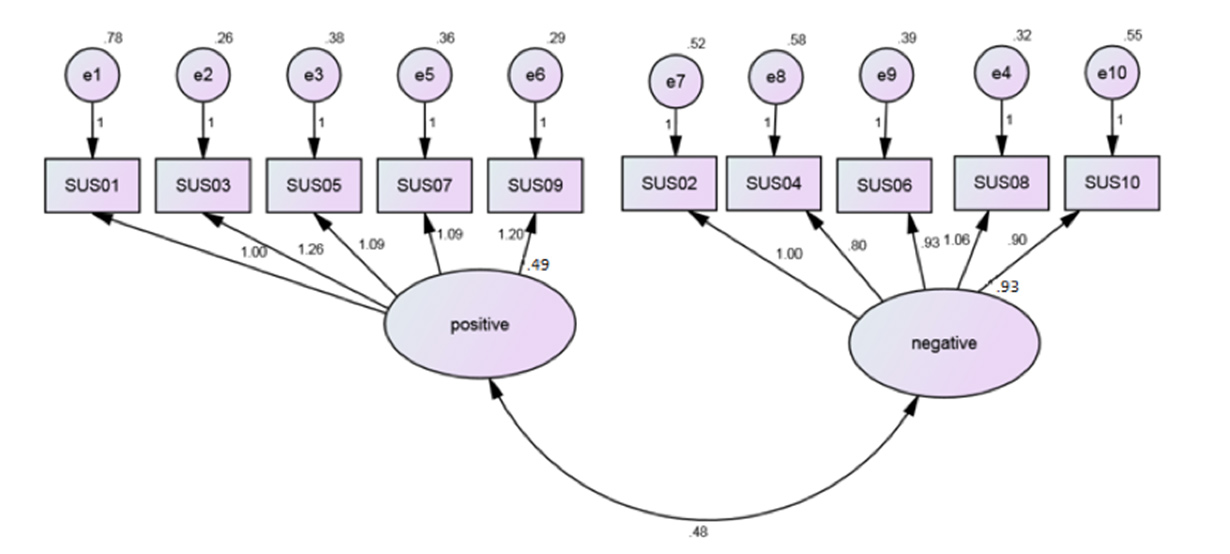
While other papers since 2009 had consistently found more than one factor (good), there wasn’t consistency in which items loaded on the two factors (not good). More troubling, several papers found that in fact the two factors were based on the positively and negatively worded items.
That is, items that were phrased positively clumped together (e.g. The system is easy to use) and negative items clumped together (e.g. I found the system very awkward to use). This isn’t helpful and another unfortunate artifact of using positively and negatively worded items in the same questionnaire—something we reported in our 2011 CHI paper [pdf]. In light of these findings, we conducted another study reviewing 9,000 completed SUS questionnaires using a Confirmatory Factor Analysis (CFA) to see whether the learnability factor should stay or go.
We compared three versions (called models) of the SUS:
- Single Factor: Original SUS
- Two Factor: Learnability & Usability Factors
- Two Factor: Positive & Negative Item Factors
Unfortunately, the best fitting model was #3, the positive and negative two-factor version (as shown in the diagram below). Because a distinction based on item tone is of little practical or theoretical interest, we recommend that practitioners treat the SUS as a unidimensional measure of perceived usability, and no longer routinely compute Usability and Learnability subscales. In short, drop the learnability factor.
2. Leave out one SUS item (if you must)
One common question about the SUS we’ve heard is whether it’s okay to replace a problematic SUS item with a different item or leave out one item.
For example, the first item is “I think I would like to use this system frequently.” If the system under study is one that would only be used infrequently (like a support website), then there is concern that including this item would at worst distort the scores, and at best may confuse participants.
Jim and I analyzed 9,156 completed SUS questionnaires from 112 unpublished industrial usability studies and surveys and compared the 10 items score to all possible 9 items scores. We found a negligible difference in the 9-item SUS score compared to using the full 10 items (paper in press).
On average the differences were within one point (out of a hundred) of the mean of the standard SUS. Thus, if practitioners feel strongly about removing an item, they can leave out any one of the SUS items without having a practically significant effect on the resulting scores. The major thing to note is an appropriate adjustment needs to be made to the multiplier—specifically, multiply the sum of the adjusted item scores by 100/36 instead of the standard 100/40—to compensate for the dropped item.
3.UMUX-Lite shows promise as a substitute for the SUS
In response to the need for shorter questionnaires, Finstad introduced the Usability Metric for User Experience (UMUX) in 2010. Several papers modified it to generate the UMUX-Lite, a two-item questionnaire with the following items (with both five-point and seven-point response option variations).
- [This system’s] capabilities meet my requirements.
- [This system] is easy to use.
Across multiple studies, the UMUX-Lite has been found to be highly correlated with the SUS, often explaining over 85% of the variance. In many cases, there is only a 1% difference in SUS scores when using the 2-item UMUX-Lite instead of the full 10-item SUS. SUS scores can then be estimated using a regression equation. The UMUX-Lite may become a viable substitute for the SUS.
4. The SUPR-Q ease factor predicts the SUS
The SUPR-Q was developed for websites as a natural extension of the SUS. It measures the perception of the quality of the website user experience using 8 items. Including a global score, it has four subscale scores on usability, appearance, trust, and loyalty. The two items that make up the usability factor are:
- This website is easy to use.
- It is easy to navigate within the website.
The average score of these items also correlates highly with the SUS (r = .87). Like the UMUX-Lite, the correlation is so high that we can generate a reliable SUS equivalent score when using the SUPR-Q (also using a regression equation). In short, for websites, the SUPR-Q is also a viable substitute for the SUS.


