Do People Use All Available Response Options?

Researchers love to argue about the “right” number of points to use in a rating scale response option. Is the right number five, seven, three, ten, or eleven? The opinions often exceed the data for helping drive the decisions. When there are data, they are often hard to generalize, or they don’t really support the

Read More »

Evaluating NPS Confidence Intervals with Real-World Data

The Net Promoter Score (NPS) is a popular business metric used to track customer loyalty. It uses a single likelihood-to-recommend (LTR) question (“How likely is it that you will recommend our company to a friend or colleague?”) with 11 scale steps from 0 (Not at all likely) to 10 (Extremely likely). In NPS terminology, respondents

Read More »

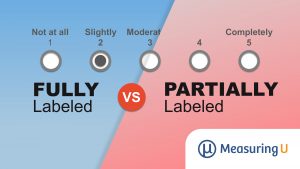
Comparing Fully vs. Partially Labeled Five- and Seven-Point Scales

In our earlier article, Jim Lewis and I reviewed the published literature on labeling scales. Despite some recommendations and “best practice” wisdom, we didn’t find that fully labeled scales were measurably superior to partially labeled scales across the 17 published studies that we read. In reviewing the studies in more detail, we found many had

Read More »

The UX of Fitness and Nutrition Websites

Each January millions of people make New Year’s resolutions. One of the most popular is to lose weight and stay in shape. Gyms get packed each January, then around Valentine’s Day the “resolutionary” crowds tend to fade away. It’s not easy to change habits but several websites try to help you build the right fitness

Read More »

46 UX Metrics, Methods, & Measurement Articles from 2019

Happy new year from all of us at MeasuringU! In 2019 we posted 46 new articles and added significant new features to MUIQ—our UX testing platform—including think-aloud videos with picture in picture and an advanced UX metrics dashboard. We hosted our seventh UX Measurement Bootcamp, and MeasuringU Press published Jim Lewis’s book, Using the PSSUQ

Read More »

The UX of Outdoor Retail Websites

There’s a lot to do outside. Biking, hiking, fishing, hunting, boating, and driving an RV all fall under the umbrella of the outdoor recreation industry. Depending on how broadly it’s defined, it can be anywhere from a $10 billion to $800 billion industry. And all the gear needed for these outdoor activities can be bought

Read More »

The UX of Online Job Searching Websites & Apps

Around a quarter of Americans change jobs each year. For most, that job search happens online. Job related websites are a multibillion-dollar business with plenty of competition. They have made finding and applying for jobs more accessible and easier. However, the process isn’t without issues. Job descriptions can be misleading, and the application process can

Read More »

Picking the Right Dependent Variables for UX Research

What gets measured gets managed. It’s more than a truism for business executives. It’s also essential for the user experience professional. In business, and UX research in particular, you don’t want to bring focus to the wrong or flawed measure. It can lead to wrong decisions and a misalignment of effort. In an earlier article,

Read More »

Where Do UX Research Methods Come From?

UX professionals use many methods to help understand and improve the user experience. Among the most popular are usability testing, expert reviews, surveys, and card sorting. But where did these methods come from? The field of UX research is relatively new, but its methods are not. And while UX methods may have new names, many

Read More »

The UX of Dating Websites & Apps

Online dating websites are one of the primary ways people find dates and even future spouses. These sites represent the bulk of a 3 billion dollar dating services industry. In fact, around 30% of recent marriages started online, but it’s not like finding a date is as easy as filtering choices on Amazon and having

Read More »
0
    0
    Your Cart
    Your cart is emptyReturn to Shop
    Scroll to Top