Can You Take the Mean of Ordinal Data?

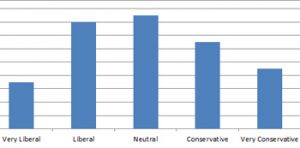
Yes, of course you can. But it depends on who you ask! It’s a common question and point of contention when measuring human behavior using multi-point rating scales. Can you take the average of a Likert item (or Likert-type item) similar to the following? The website is easy to use: Here’s how 62 participants after

Read More »

Visualizing Data: Raw vs Difference Scores

One of the best ways to make metrics more meaningful is to compare them to something. The comparison can be the same data from an earlier time point, a competitor, a benchmark, or a normalized database. Comparisons help in interpreting data in both customer research specifically and in data analysis in general. For example, we’re

Read More »

How to Handle Multiple Comparisons

You go to your doctor for a checkup. You’re feeling fine but as a matter of procedure, your doctor orders a battery of tests and scans to be sure all is well. She runs 30 tests in total. A few days later she calls and tells you one of the tests came back positive–an indication

Read More »

5 Steps for Better Customer Sampling

For most customer research, you’re rarely able to measure the attitudes or behaviors of everyone. Instead you take a sample of your customers and use this sample to make inferences about the rest of your customers. Even if you’re in a situation where you can collect data from all current customers, it’s not possible to

Read More »

Managing False Positives in UX Research

Don’t you hate when that email you were looking for ended up in your spam folder? Or when you go through security at the airport and the medical detector flags your belt or shoes as something nefarious? Or when you get a medical test back that indicated a problem only to find out everything was

Read More »

What are the Odds?

Percentages are popular. Executives like them, the media reports them, and we hear them every day. We use percentages all the time in UX research. They can be based on demographics: Percent women Percent millennials Percent who are current customers Or based on attitudes and actions: Percent completing a task Percent recommending a product Percent

Read More »

5 Advanced Stats Techniques & When to Use Them

To answer most user-research questions fundamental statistical techniques like confidence intervals, t-tests, and 2 proportion tests will do the trick. But to answer some questions most effectively you need to use more advanced techniques. Each of these techniques requires specialized software (e.g., SPSS, Minitab, R) and training on how to set up and interpret the

Read More »

Comparing Between and Within Subjects Studies

When you’re planning a study to compare multiple interfaces, one of the first choices to consider is whether to use a within-subjects or between-subjects approach. The interfaces can include anything you want to compare: design mockups, competing websites, or a new mobile app design with an old mobile app design. The choice comes down to

Read More »

5 Essential Statistical Tests and Calculators

You can slice and dice data in a lot of ways using a variety of statistical tests. The type of study, data type, and your research question will dictate the right statistical test you need to perform. With the five tests I cover here, you can test most of your hypotheses in the customer experience.

Read More »

10 Statistics Articles for Researchers

Geek out this summer and catch up on some stats. With your kids home from school with their reading lists, now’s the perfect time to create a reading list of your own to tackle this summer. I know reading statistics articles probably isn’t your idea of a summer vacation; however, I’ve selected ten articles from

Read More »
0
    0
    Your Cart
    Your cart is emptyReturn to Shop
    Scroll to Top