 Finding and fixing usability problems in an interface leads to a better user experience.
Beyond fixing problems with current functionality, participant behavior can also reveal important insights into needed new features.
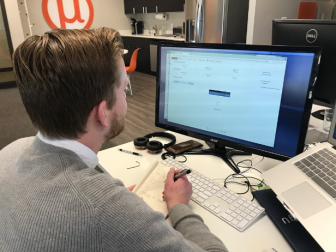
These problems and insights are often best gleaned from observing participants interacting with a website, app, or hardware device during actual use or simulated use (during a usability test).
With the advent of remote testing platforms like MUIQ, you can collect videos of hundreds of people attempting tasks in a short amount of time. It can take quite a long time to actually view every video though. You ’ll, therefore, want to make the most of your time by systematically learning as much as you can and coding observations into insights. Here’s the process we follow:
1. Start with a random (or pseudo-random) sample of videos.
If you have a lot of videos to watch for a task (e.g. 50+), pick a subset to start with. I recommend picking every 5th or 10th video so the videos you watch aren’t all from the beginning or end of the study. If you have a smaller number of videos (say < 20) then this step is less important and you can take the time to watch all of them.
2. Record the ID of the participant and task.
Note which participant’s video you’re watching and—if multiple tasks—which task was attempted. Videos can all start to look the same and you may need to review a video to look for additional insights. You don’t want to realize later that you don’t know which video you have notes for.
3. Look for symptoms of problems.
Before starting a video, look for other metrics from the participants, such as a failed task attempt, a long task time, or low post-task ratings. Knowing these metrics can give you a clue as to what you’re looking for (sort of like reading the summary at the end of a chapter before you read it). When selecting a subset of videos to watch, we often start with the failed task attempts first.
4. Identify an issue or insight.
In viewing the video, look for hesitations, mistakes, slips, and even lots of scrolling. Note the time in the video the incident occurred and describe it.
For example, if you know a participant failed a task (Step 3), look to see where the turning point was in the task interaction: Did they click the wrong link, were the search results poor? Don’t just limit your notes to problems. If you notice, for example, that a lot of participants interact with a featured product or use search effectively, consider noting this behavior too.
5. Look for the root cause.
Identify what in the interface (if anything) is potentially causing the problems identified.
If a participant clicked a non-clickable element, which one was it and can you deduce why? If a participant isn’t clicking something they should, is it because it’s not loading, not noticeable, or not phrased properly? If participants search for a featured product, but it’s buried on the second page of the search results, note this.
6. Repeat for the next participant.
Go through the next videos looking for other examples of the issue you identified as well as new problems and insights. After watching a few videos, you may need to return to an earlier video and recode or look to see whether you overlooked an issue you identified later. All the more reason to be sure you log the participant and task properly in Step 2.
7. Provide a frequency.
Of the videos you watch, compute the percentage of all participants that encountered the issues. For example, if 10 of 20 participants had a problem using the filters on a website, note the number with the percentage: 50%. This is especially helpful when you’re sampling from a large number of videos; the more videos you watch, the more issues you will uncover. Having a percentage, instead of just the raw numbers, allows you and your stakeholders to better gauge the prevalence.
8. Present.
Use a screenshot or the video itself in a presentation to communicate the issue or insight to stakeholders. Similar to other usability issues, give recommendations when there’s a clear fix.
Here’s the result from the previous seven steps for an example from a retail website.
We watched 17 videos (from a total of 150 participants) from a retail website benchmark study that asked participants to select a blender with a minimum number of reviews.
Of the 17 videos, 12 participants (70%) encountered a significant delay or were unable to complete the task when the reviews weren’t showing up. The delay varied for some participants and is an example of where we went back to review videos after we noticed this issue. It’s also an example of a hybrid bug and feature. The site loaded most static content first to enable quick browsing (good) but the delay in dynamic content caused a new issue (bad).
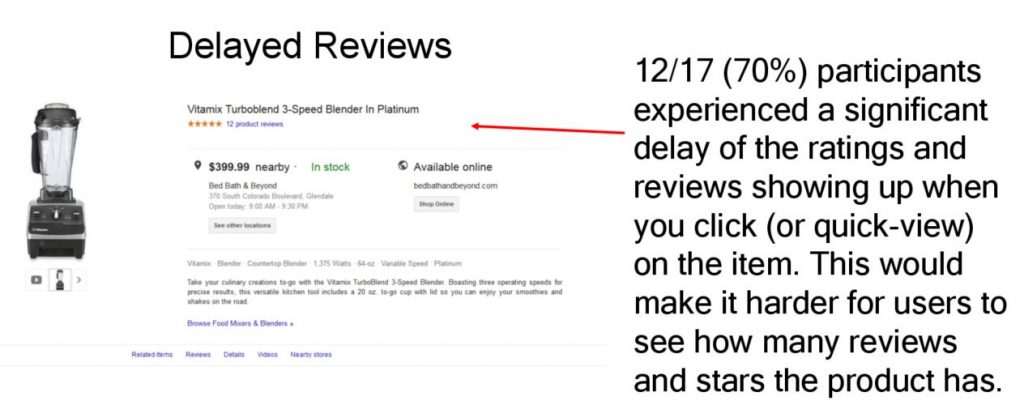
Figure 1: Example of a problem (delayed reviews) observed in 12 (70%) of videos watched.
Ratings and reviews are an important part of the shopping experience, so if participants don’t find these easily, they’re likely to look elsewhere (often Amazon).
9. Bonus insights: Include severity, global vs local, and confidence intervals.
You can also add additional information about the problems you uncover as you would for a standard usability test to prioritize the problems. This information can include
- Global or local: Is the issue affecting only one page or part of an application (local) or does it affect the entire website or app (global)? The difference has implications on both impact and potential development efforts.
- Assign a severity rating: You can categorize a lot of issues by severity. Even a simple three-point scale suffices to separate the trivial from the severe.
- Add a confidence interval: To understand what percentage of the population a problem will impact, provide the lower and upper bounds of the confidence interval using the Adjusted Wald calculator. For example, we can be 90% confident the review problem with the blender identified above will affect 50% and 85% of the population—a big impact uncovered from watching a relatively few number of videos.
Here are two more examples. Figure 2 shows that after watching five participant videos on AT&T, none of the participants were able to find the right phone plan. This problem corresponds to a very low task completion rate.
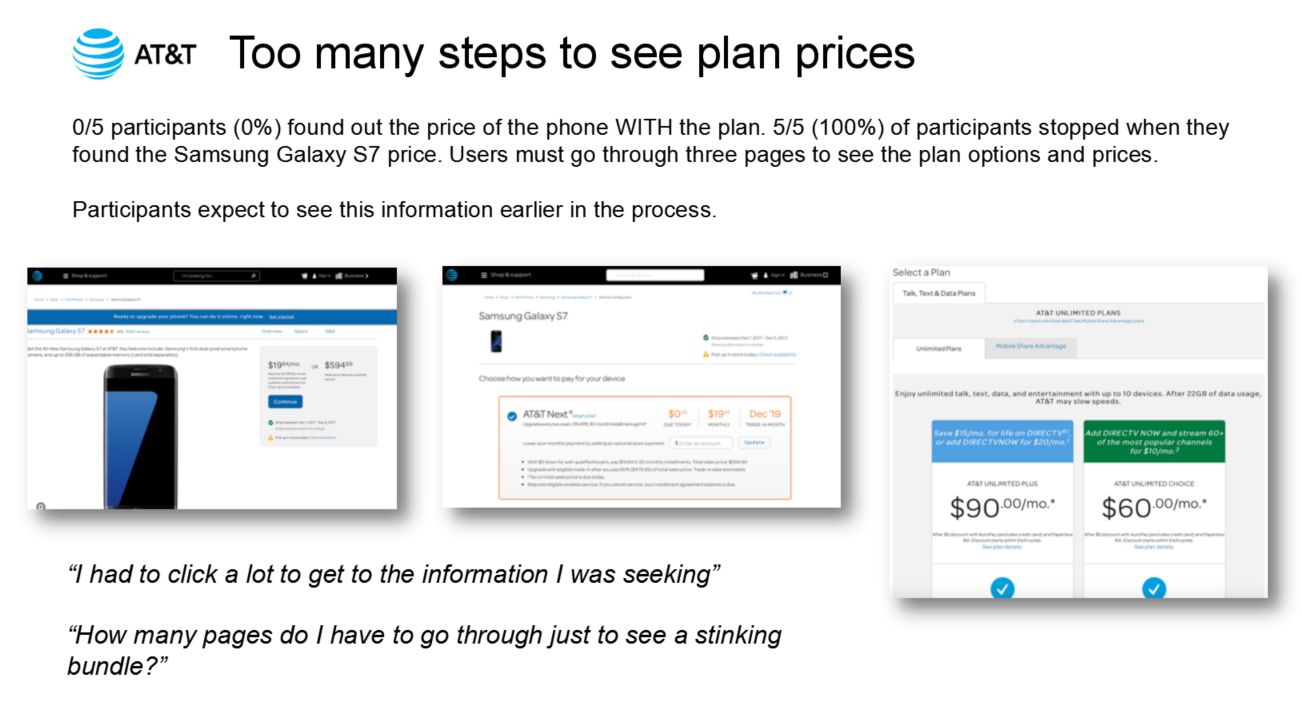
Figure 2: Example of a problem on a wireless carrier website (too hard to find prices for phones with plans) from watching 5 videos.
Figure 3 shows two problems uncovered from watching 37 videos on OpenTable.com. 6 participants had a problem expanding the filter to find the French option and 15 participants had a problem finding smaller cities. Both issues contributed to long task times in this restaurant-review benchmark.
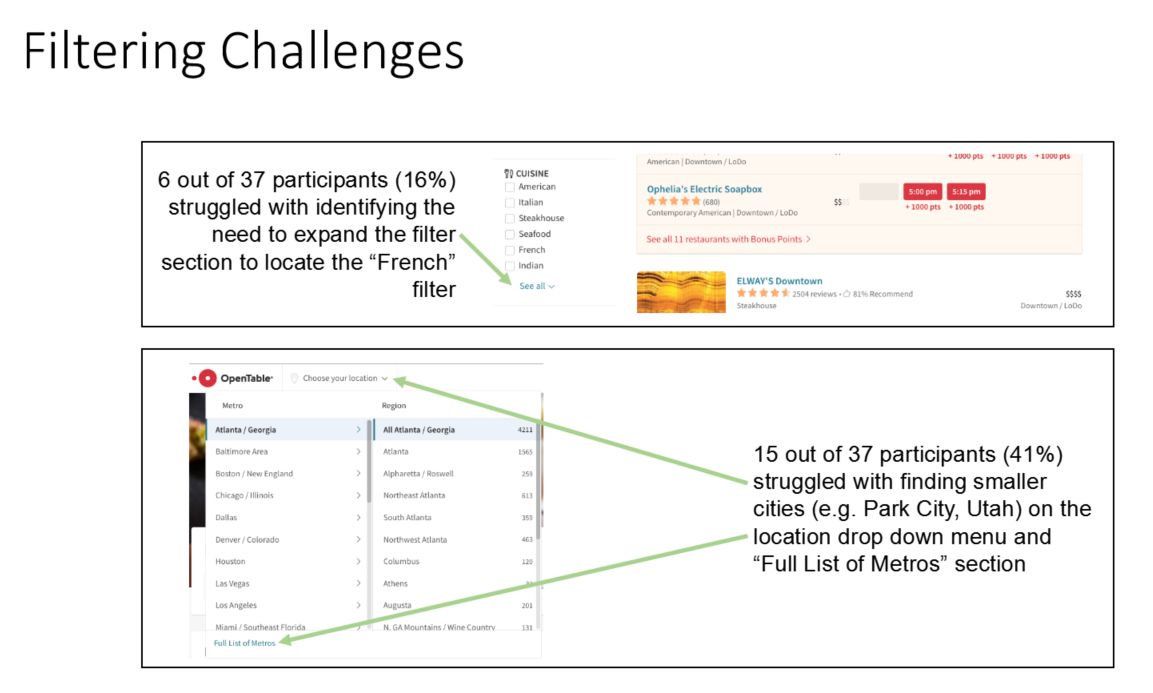
Figure 3: Example of two issues uncovered on Opentable.com from observing 37 videos.

")
")