 A benchmark study tells you where a website, app, or product falls relative to some meaningful comparison.
This comparison can be to an earlier version, the competition, or industry standard.
Benchmark studies are often called summative evaluations as the emphasis is less on finding problems and more on quantitatively assessing the current experience.
To quantify, you need metrics and UX benchmark studies can have quite a few.
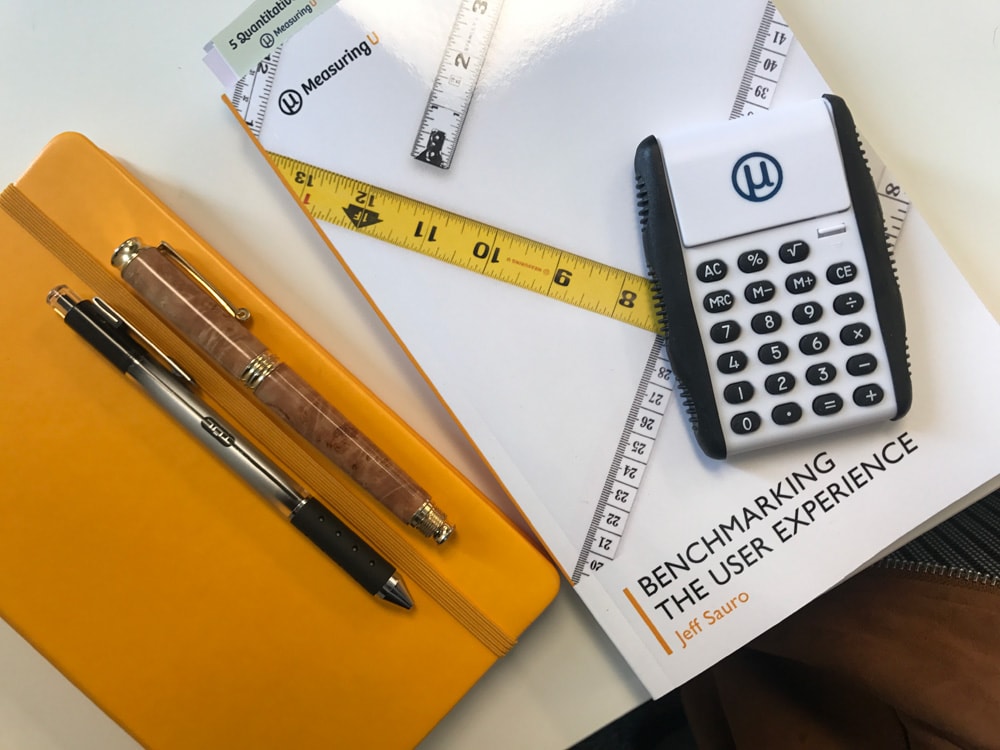
Last week I released my 6th book, Benchmarking the User Experience, to help research teams more effectively measure and improve their interfaces through benchmark testing. In Chapter 5 of the book I cover the essential benchmark metrics in detail.
These metrics cover both the broader experience (study-level metrics) and the more granular task-level metrics (if the study has tasks). While they aren’t exhaustive (there seem to be endless ways to measure an experience), they’re the most common and effective. Here’s a summary of those metrics and ideas on when to use them.
Study-Level Metrics
- SUPRQ: This compact questionnaire is ideal for benchmarking a website user experience. It provides a measure of the overall quality of the website user experience and its scores are normalized into percentile ranks. It also includes measures of usability, appearance, trust, and loyalty. A license is available to access the normalized database and the items can be used without a fee with attribution.
- SUS: This 10-item questionnaire measures perceived usability of any user experience. The System Usability Scale has been around for 30 years and is best used for measuring software or hardware interfaces. Its popularity and longevity mean you can reference published databases (for example, the average SUS score is 68).
- NPS: The Net Promoter Score is a popular/notorious measure of customer loyalty that can be applied to all interfaces (desktop, mobile, hardware) and for both consumer-to-business and business-to-business experiences. It’s based on responses to a single 11-point item asking participants how likely they are to recommend the experience (which can be a brand, website, product, feature, or page).
- General Satisfaction: Satisfaction is a fundamental measure of people’s expectations with an interface. As basic and old-school as it is, it still tends to be a good predictor of future business performance. Satisfaction with the overall interface or brand (which can often be the same thing—e.g. Amazon, eBay) provides a broad perceptive about current attitudes (which affects behavior).
- Specific/Attribute and Satisfaction: General satisfaction isn’t very diagnostic. To generate more specific and diagnostic measures of customer attitudes, ask about the satisfaction with features or more specific parts of an experience: the product page, search results, or customer support to name a few.
- Brand Attitude: Brand attitude is a consistently strong influencer on other UX metrics. Understanding what people think about an organization that creates an interface (e.g. Facebook, Amazon, Walmart) can explain a lot of the variation in other attitudinal metrics (like NPS, SUPR-Q, SUS, and satisfaction) and words people associate with the brand. We consistently seen brand attitude as a key driver of UX metrics in our industry reports.
- Brand Lift: Measuring a user’s attitude towards a brand before and after a study helps identify how much of an effect the experience has (positive or negative) on brand attitudes.
- UMUX-Lite: This compact measure of perceived usefulness and perceived ease is like a mini-version of the Technology Acceptance Model (TAM) and also has been shown to be a good and shorter substitute for the SUS.
- SUPR-Qm: This questionnaire for the mobile app user experience is administered dynamically using an adaptive algorithm.
Task-Level Metrics
For benchmark studies with tasks (versus only retrospective studies), the following metrics provide a granular view of the user experience and usually offer more clues as to what needs to be fixed.
- Task Completion Rate: This fundamental metric of effectiveness tells you whether participants can complete a task (1 = success and 0 = failure).
- Task Ease: The perception of a task experience measured using the 7-item Single Ease Question (SEQ) provides a succinct way to describe a participant’s attitude toward the immediately attempted task. While it correlates with post-study metrics (like SUS and SUPR-Q), it provides additional information those broader measures don’t.
- Task Time: The fundamental measure of efficiency provides a sensitive way of understanding how long it takes participants to complete (or fail) tasks. You can provide measures of average task completion time (successfully completed attempts), average task time (average time of all participants) or mean time of failure (average time till participants fail a task). We usually use average task completion time using an appropriate transformation to handle the inherent positive skew in this measure. We prefer this measure over clicks.
- SUM: This is the average of standardized versions of completion rates, ease, and time combined into one measure that describes the usability of a task. It’s ideal for when you want a single metric to describe a task experience, especially in a competitive benchmark.
- Confidence: Measured using a 7-point scale immediately after a task, confidence leads to competence (higher completion rates). Participants are generally over-confident (men more than women), but low confidence can be a good symptom of problems. This measure of participant confidence is different than a confidence interval.
- Disasters: Using confidence ratings in conjunction with completion rates allows you to compute disasters—when participants fail a task but rate that they were extremely confident. A task failure with a 7 out of 7 on task confidence is a disaster. The only thing worse than failing a task is thinking a participant did it correctly but really failed.


