 The range of methods available to the researcher is one of the things that makes UX research such an interesting and effective field.
The recently completed UXPA salary survey provides one of the more comprehensive pictures of the methods practitioners use.
It contains data from over 1200 respondents from 37 countries collected in 2016. Similar data was collected in 2014 and 2011 with similarly sized samples.
Here is an overview of how common methods are used and how that use has changed over time. Note: Differences of greater than about 5% across years or methods are statistically significant.
Usability Testing
As has been the case since 2011, usability testing is the most common method, with some 80% of respondents using it. Usability testing has evolved in the last decade with many more options that provide unmoderated and remote moderated testing in addition to traditional lab-based testing.
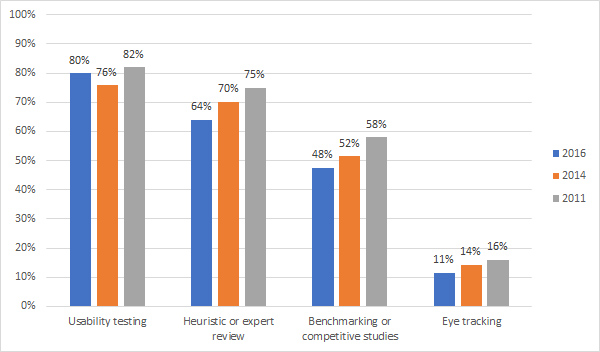
Expert Reviews
Expert reviews are a popular usability technique, often referred to as heuristic evaluations even though there is a difference. Reported usage was 64% of respondents, down from 75% in 2011. Expert reviews are best done in conjunction with usability testing. And we see that happening here too. Of the respondents who report using expert reviews, 89% also report performing usability testing (although not necessarily in tandem).
Benchmarking
Benchmarking a website using standardized metrics and against competitors is an essential step in understanding how design changes improve the experience. Roughly half of respondents report benchmarking or running competitive studies. I wonder if the slight downward trend in benchmarking has to do with outsourcing as a benchmark study has a lot of moving parts. To help, we provide both the software and service to conduct unmoderated studies as well as a checklist to avoid common problems.
Eye-Tracking
Eye-tracking remains a more niche method with 11% percent of respondents report using it for their job. While eye-tracking has gotten a lot cheaper in the last decade, its usage hasn’t changed much since we started tracking it in 2009 when 13% reported using it (not shown in the graph). Its more limited use may reflect the considerable time and training needed to involve eye-tracking. When we conduct eye-tracking studies for our clients, we advise around 10 minutes of processing and analysis time for every one minute of video.
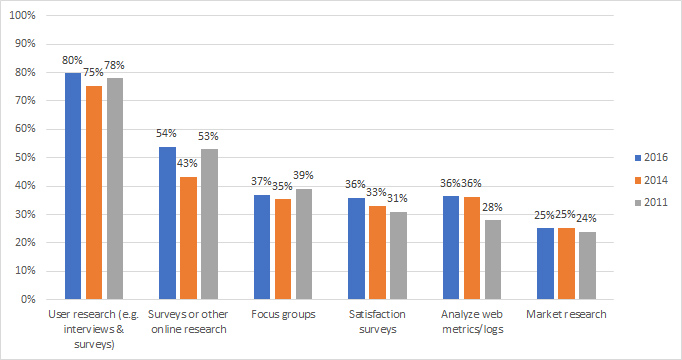
User Research
User research is a broad term that encompasses many methods, both qualitative and quantitative. Not surprisingly then, most respondents report doing some form of user research. The percentage has remained relatively unchanged since 2011.
We’ve seen a continued blending of market research and user research over the last decade. While fewer respondents consider their activities “market research” (only a quarter do), more report using methods also employed in market research, including surveys and focus groups. In fact, the method some UX researchers love to hate—focus groups —continues to be used by almost 40% of respondents.
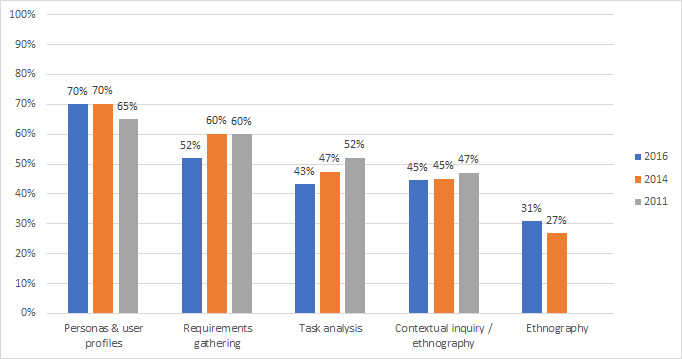
Defining Users & Requirements
Understanding who users are and what they want to accomplish with an interface are essential aspects of improving the user experience. Personas have remained popular with a slight reduction in the number of respondents collecting requirements and conducting a task analysis. A bit less than half of respondents report conducting contextual inquires—a valuable method for understanding how users interact and solve problems.
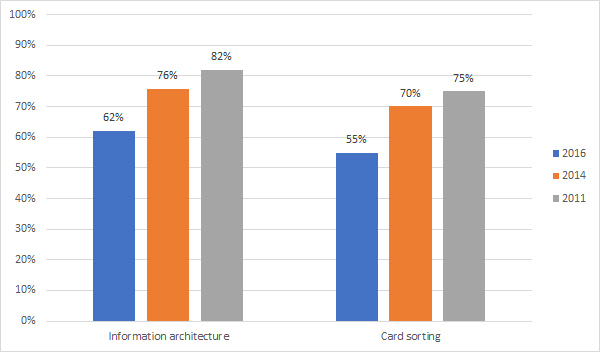
Information Architecture
We’ve consistently found that the ability to find products and information easily is what differentiates good websites or products from bad ones. There’s a science to findability and it involves a number of methods and techniques. The UXPA survey asks about one popular method, card sorting, which has seen a drop in reported usage since 2011.
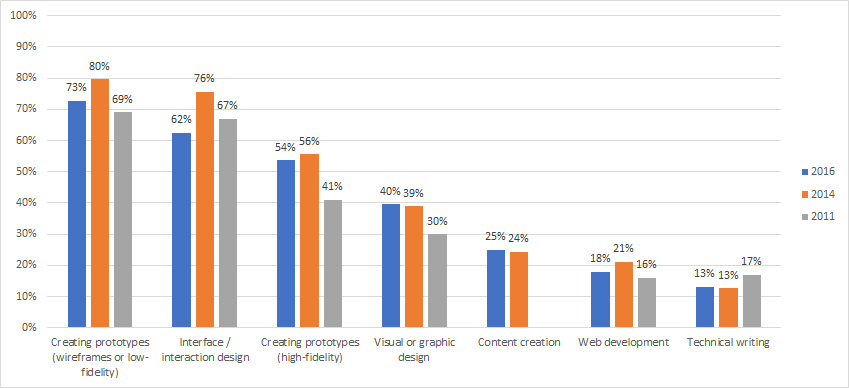
Prototyping & Design
Design is a fundamental part of the user experience. Not surprisingly, more than 70% of respondents report using some form of prototype or wireframe. We test high-fidelity prototypes built from InVision quite frequently. The high percentage of respondents using wireframes or low-fidelity prototypes also speaks to the popularity of the Lean UX mindset of testing minimum viable concepts early and often.
A note on the sample characteristics. In 2016, 37% of respondents report being either a visual or interaction designer, compared to 43% in 2014. This lower percentage may account for some of the drop in reported usage across methods. More information on the full sample characteristics are in the full report.
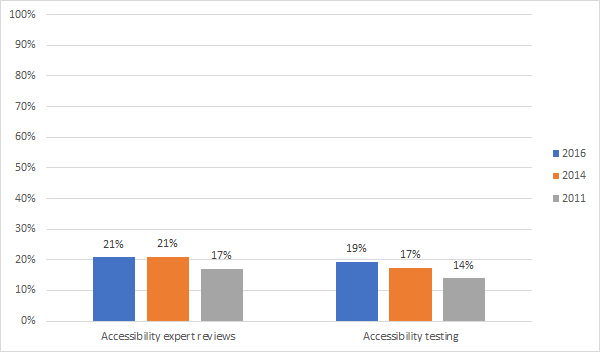
Accessibility
Accessibility remains a more niche activity for this group of respondents but there seems to be a steady growth in assessing accessibility since 2011.
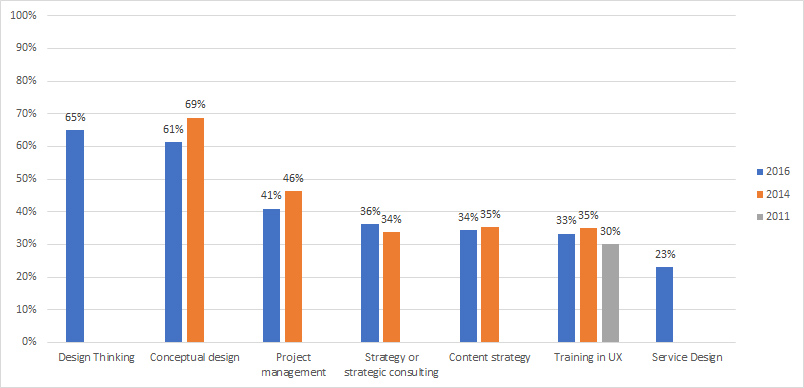
Strategy, Training, & Design Thinking
Strategy, project management, and training in UX remain common activities. Two new additions to the survey this time were the trendy topics of Design Thinking and Service Design. While these were selected by 65% and 23% of respondents respectively, I’d consider these more mindsets than tactical methodologies like a usability test. It’ll be interesting to see how popular these remain over the subsequent surveys.
Summary
There are a number of methods available to the UX practitioner. The results of the 2016 UXPA salary survey reveal that some core methods, despite their age, remain popular, including usability testing, expert reviews, personas and prototyping. Some newer approaches, including Design Thinking, are currently popular, and the frequency of use of other methods, including eye-tracking, accessibility reviews and contextual inquiries have remained relatively steady since 2011.
")

