 The PURE (Practical Usability Rating by Experts) method is an analytic technique that identifies potential problems users may encounter with an interface.
In a PURE evaluation, evaluators familiar with UX principles and heuristics break down tasks into small steps. They then rate each step, from 1 to 3, based on a pre-defined rubric. The higher the score, the more difficult the experience.
As we continue to use the PURE method, we find areas of improvement and I provided some in an earlier article.
PURE’s Place
PURE, like other analytic techniques, is not a substitute for usability testing. It’s ideally suited when it’s not easy to test with actual participants (because of budget, time, or difficulty in finding participants).
I’ve been asked how the PURE method differs from other known analytic techniques such as the cognitive walkthrough or heuristic evaluation. Christian Rohrer, who created the method, sees two main differences. 1) PURE can be applicable to any user type or persona (not just the new users the cognitive walkthrough recommends). 2) The scoring system provides more degrees of discrimination (more scale points) than the simple yes/no questions used in the CW.
I see PURE as a logical extension of the cognitive walkthrough and heuristic evaluation. In practice, we’ve already streamlined the traditional CW questions (finding the original ones a bit redundant). PURE essentially adds a metric to this already known procedure. I suspect one could obtain similar scores to a PURE score by adding the total number of “no” answers to the CW questions.
PURE Validation
As part of its original validation, we collected PURE data to see how well it would predict UX metrics (SUS, SUPR-Q, NPS, completion rates, task ease, and task time).
We conducted a traditional UX benchmarking study on three consumer software products (15 moderated participants) and eight websites (202 unmoderated participants).
We found statistically significant correlations between task-level ease (SEQ was r=.5) and test-level questionnaires (SUS was r=0.5 and SUPR-Q was r=0.6). We didn’t find significant correlations with task time and completion rates.
Replication Study on Banking & Health Insurance Websites
To replicate these findings, we conducted another round of PURE evaluations on six popular consumer banking websites and four health insurance websites. For the banking websites, we defined two tasks: find the checking account fees and find the nearest branch. For the health insurance websites, we had a single task: find a chiropractor that accepts a specific insurance (near a zip code). The task details and results are available in the banking SUPR-Q report and health insurance report.
We used five evaluators trained in the PURE method to look for more corroborating data. Two evaluators independently conducted a PURE evaluation on the banking websites. A second set of evaluators conducted a PURE evaluation on the health insurance websites. After their ratings, both groups conferred with a third evaluator and reconciled any differences in scores until they arrived at a total score for each task.
Next, we had 184 participants attempt the same two tasks on one of the banking websites. For the health insurance websites, the data was already collected but not shared with the evaluators. (Two websites were removed from the PURE analysis as their designs substantially changed between data collection and PURE analysis.) For the health insurance websites, 129 participants attempted the task on one of the four health insurance websites.
For both studies, participant data was collected in an unmoderated usability test using MUIQ. We recorded participants’ screens and collected the common task-level (completion rate, time, SEQ, and confidence) and study-level (SUPR-Q) metrics. Each task experience had between 28 and 34 participants.
We correlated the task-level average scores with the PURE scores. To compare the SUPR-Q score with PURE, we averaged the PURE scores for both tasks for the banking websites. This gave us an opportunity to compare 16 PURE scores with 16 post-task scores (two tasks on six websites and one task on four websites) and 10 post-study scores (ten websites). The correlations are shown in Table 1.
| Metric | r |
|---|---|
| Completion Rate | -0.21 |
| Time | 0.88 |
| Confidence | -0.72 |
| SEQ | -0.67 |
| SUPR-Q | 0.55 |
Table 1: Correlations between PURE scores and task-level metrics (n=16) and SUPR-Q scores (n=10).
We found the magnitude of the correlations ranged from r=.21 to .88. The negative correlations show that as PURE scores go up, perceived confidence and task ease go down (the expected relationship). At a sample size of 16, the SEQ and confidence correlations (r=-.67 and r=-.72 ) were statistically significant at p <.05. The relationship between SEQ and PURE is shown in Figure 1. We found PURE scores can explain (or predict) about 45% of the variation in SEQ scores—similar to and slightly higher than the initial validation study.
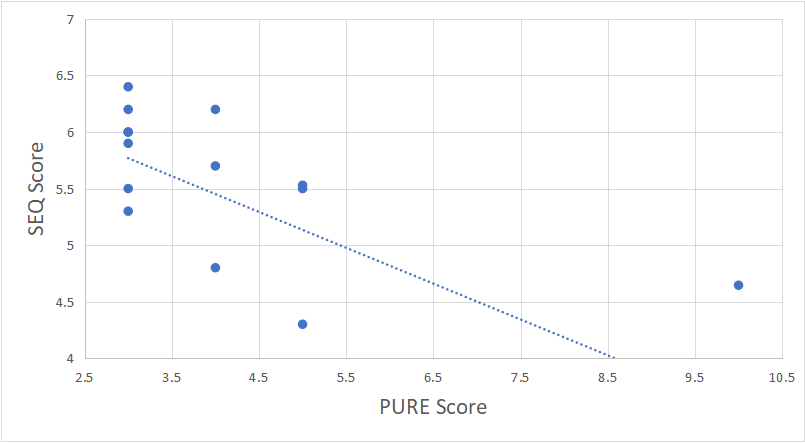
Figure 1: Correlation between SEQ (task ease) scores and PURE scores (r=-.67) shows that as tasks are rated harder by evaluators, study participants also rated them harder (lower SEQ scores).
The correlation for completion rates had the lowest correlation (r=.21) and it is not statistically significant. The magnitude of correlation with the SUPR-Q score (r=-.55) is also similar to what we found in the initial validation study. At the sample size of 10, though, the correlation is not statistically different than 0 at the p <.05 level of significance (p=.09). Somewhat surprisingly, the correlation with task time is the largest (r=.88) and statistically significant as shown in Figure 2. Task time was not statistically correlated with PURE in the original study and it could be that including a larger variation of tasks (and task duration) uncovered this relationship.
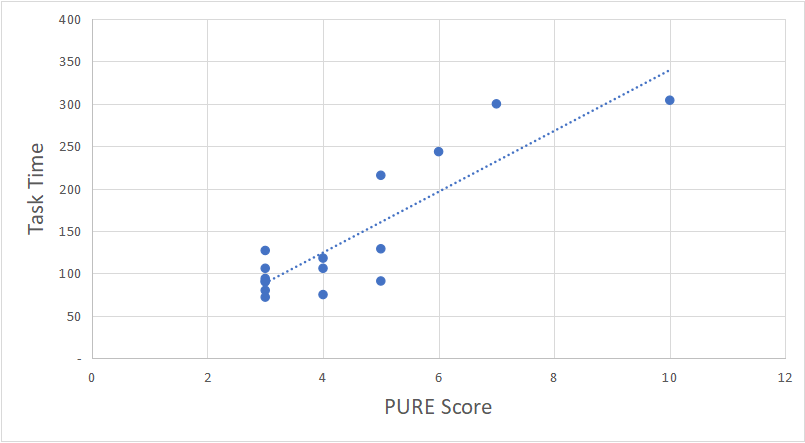
Figure 2: Correlations between task time and PURE scores (r=.88) shows that as tasks take longer (on banking and health insurance websites), PURE ratings from evaluators also increase.
Conclusions
With two independent studies we found PURE scores tend to predict task-level ease (SEQ scores) generally well, and to a lesser extent predict study-level metrics (SUPR-Q). The current study revealed a strong relationship between PURE scores and task time. Future analyses will help us refine these relationships and examine more complex tasks across different domains and interface types (e.g. mobile). The data so far is encouraging because it shows that PURE scores can predict UX metrics with reasonable accuracy and have the added benefit of providing detailed interactions that tend to be more diagnostic (similar to what’s obtained in a cognitive walkthrough). Practitioners may benefit from using this analytic technique when it’s difficult to test with actual users and especially in cases when they need an easy way to quantify potential interaction problems (and know what to fix).


