 UX attitudes can be associated with future website behaviors.
We described how to create this linkage in an earlier article that described the results of an exploratory longitudinal study.
In that article, we discussed the common challenges involved with linking attitudes to behaviors. Notably, attitudes about a general concept (user experience) can have difficulty predicting specific behaviors (future purchases).
Often the lack of relationship between attitudes and behaviors is not because there isn’t a relationship, but because of problems with how we measure both.
After accounting for nonlinearity and aggregating the data, we were able to find both the purchase rate and the average number of purchases for the top 25th percentile was higher compared to the bottom 25th percentile of SUPR-Q scores. There wasn’t a clear pattern with purchase amounts, though.
The sample size used in the study was relatively small. To avoid the problem of overfitting our segmentation method to our data, we considered our findings preliminary until we could corroborate with a larger, independent data set. This article describes a second, larger study to corroborate the findings that more extreme SUPR-Q® responses tend to predict future purchases.
Longitudinal Study: Nov. 2018 to Feb. 2019
We conducted another longitudinal study that had its first phase of data collected in November 2018. Due to the high dropout rate expected for a longitudinal study (and from our first study experience), we started with a much larger sample size.
We asked 3,899 participants to reflect on their most recent purchase on a website. We had them answer the 8-item SUPR-Q and other questions about their most recent purchase. To achieve some diversity, we encouraged people to select a different retailer than Amazon.com.
We then followed up with 1,160 participants once at either 30, 60, or 90 days to invite them to take another survey (in Dec. 2018, Jan. 2019, or Feb. 2019). We used our MUIQ platform to pipe in the participants’ earlier data—the response date and name of the website they reported purchasing from in November.
We presented the participants the prior purchase along with several other common brands—including Amazon, eBay, Target, Walmart, and Best Buy—to reduce the chance of participants simply selecting a choice we presented, we asked participants to select which of the websites, if any, they may have purchased from after the date of their first survey.
For each website selected, we asked them how many times they purchased and approximately how much money they spent.
For example, if a participant said on Nov. 7, 2018 that their most recent purchase was at Jet.com, they were asked:
“Not including the purchase on Nov. 7, 2018, how many times have you purchased from Jet.com?”
With choices between 0 and 5+ times.
We then asked how much money they spent using an open numeric-text field.
Results
In total, we received 525 completed responses that contained both SUPR-Q data and follow-up self-reported purchase data for 194 unique websites. This was a relatively high follow-up rate at 45%. Examples of websites participants rated the SUPR-Q for their most recent purchase include
- eBay
- Walmart
- Kmart
- T-Mobile
- Ticketmaster
- United Airlines
- Dermstore
- LuckyVitamin
- Sam’s Club
- SeaBear
- Ticketfly
- Old Navy
- Forever 21
- Groupon
- Petco
- REI
- Barnes and Noble
- Dick’s Sporting Goods
- Grubhub
Websites that received at least ten responses in the follow-up survey are shown in Table 1.
| Wesbite | Sample Size |
|---|---|
| eBay | 73 |
| Walmart | 69 |
| Target | 35 |
| Best Buy | 20 |
| Macy's | 11 |
| Steam | 11 |
Table 1: Websites and number of respondents per website from the follow-up survey.
Despite the shorter period, a similarly high percentage of respondents (80%) reported making a purchase during the follow-up period at either 30, 60, or 90 days, compared to 83% from our first study (which was for a 1-year period). The high purchase rate could be because the survey included the Christmas buying season.
The median number of purchases was 2, with a range from 0 to 5+ (participants could only select from within this range). The median spent per website was $60, also with a wide range of $0 to $10,500. The highest purchase was from a participant on the United Airlines website.
To assess the predictive validity of the SUPR-Q with this larger sample, we used the correlation coefficient r. As with the first study, the correlation between individual SUPR-Q scores and number of purchases was small at r = .09; p = .04. Even after removing the unusually large purchases, the correlation stayed low at r = .06; p = .2. The correlation between the average amount spent and SUPR-Q scores is small, not statistically significant, and going in the wrong direction at r = -.02; p = .70. Correlations, however, work best when the data follows normal and linear patterns.
Figure 1 shows the distribution of reported purchase amounts and reported number of purchases. As with the first study, the purchase amounts were highly skewed. The number of purchases is more uniformly distributed (bottom of Figure 1). This more uniform distribution and the high number of responses in the 5+ category suggests a lot of the variability of the data may have been suppressed due to the limited number of categories. A future survey should allow for more purchases (even for this short duration).
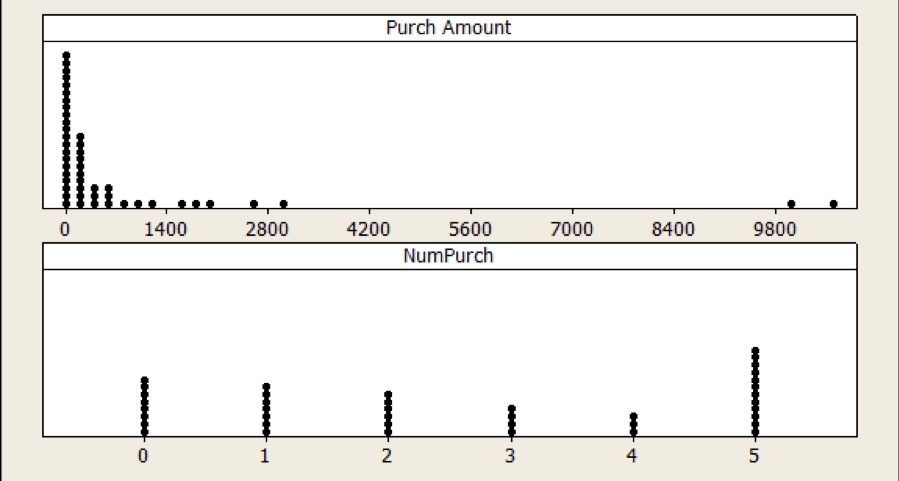
Figure 1: Distribution of the purchase amount and number of purchases made in the prior year (self-reported) on a website. Purchase amount is positively skewed, likely affecting the correlation between SUPR-Q and purchases. Each dot represents up to 32 responses and the category labeled “5” includes 5+ responses.
Figure 2 shows the distribution of SUPR-Q scores, which shows an expected positive skew with most participants reporting an above average user experience. (Note: SUPR-Q percentile ranks are computed at the website level but the dots in the figure show the individual responses to illustrate the positive skew.)
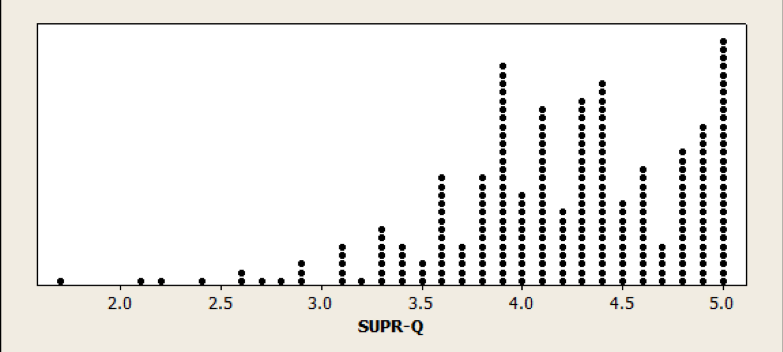
Figure 2: Distribution of SUPR-Q scores by participant shows a negative distribution.
As was done in the earlier study, we aggregated SUPR-Q responses into groups to offset the non-normality of data and look for patterns with the more extreme responders. In our first study with only 24 respondents we were limited into how we could group participants. We identified common cut points to group (bottom 25%, top 25%, top 5%, etc.).
In this analysis with a sample size 20 times larger, we can use a more conventional aggregating scheme: breaking data into quintiles (five ordered groups) and deciles (ten ordered groups). For quintiles, the lowest relative scoring respondents get grouped into the 0–20%, the next highest into 20–40%, and so forth up to the highest SUPR-Q responses at 80–100%. For deciles, we have twice as many categories (0–10%, 10–20%, and so on up to 90–100%).
Using these buckets addresses much of the nonlinearity and aggregation problem with associating attitudes to behavior. We can now correlate the average SUPR-Q score at each of the five buckets with the purchase rate (Figure 3), number of purchases (Figure 4), and amount of money spent (Figure 5).
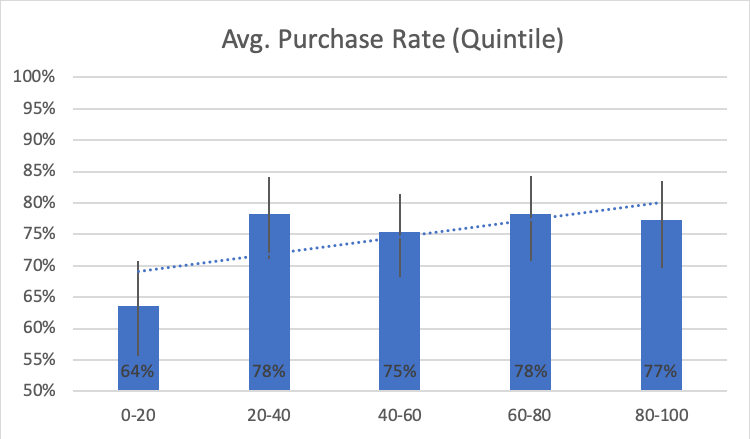
Figure 3: Average purchase rate (% of respondents that purchased) by raw SUPR-Q score quintile (top r = .78) and decile (bottom r = .57). Error bars are 90% confidence intervals.
Figure 3 shows the average purchase rate (% that reported purchasing) for the SUPR-Q quintiles and deciles. Both show a positive correlation, with higher SUPR-Q scores correlating with higher purchase rates at the higher quintile (r = .78; p = .12; n = 5) and decile (r = .57; p = .09; n = 10). The correlations are impressively large but not statistically significant given the very small number of groupings (5 and 10). The magnitude of the correlation can be compared to other correlations in the literature (e.g., with NPS and SUS).
For example, of the participants who rated their original website experience in the lowest quintile, 64% reported making a purchase in the subsequent 30–90 days. In contrast, participants who rated their experience at the highest quintile had a 77% purchase rate.
The graphs also show that purchase rate doesn’t increase in a smooth linear pattern. Instead, there is a noticeably lower purchase rate for the lowest response categories (0–20 and 0–10) followed by uneven increases (e.g., a dip at 50–60) in the deciles. This illustrates the asymmetrical relationship attitudes may have with certain behaviors.
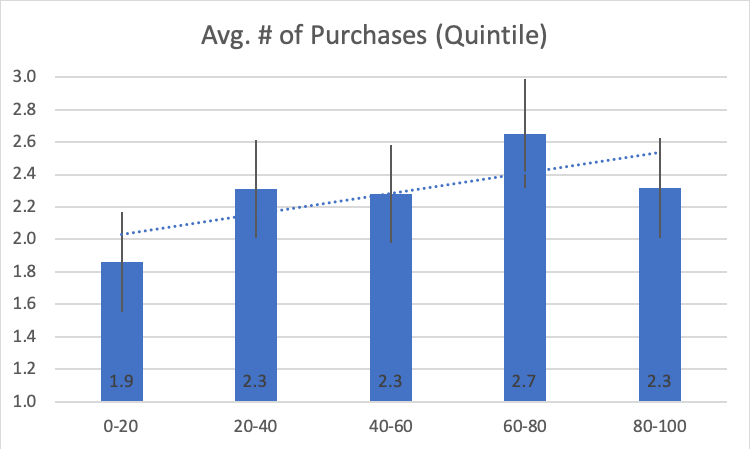
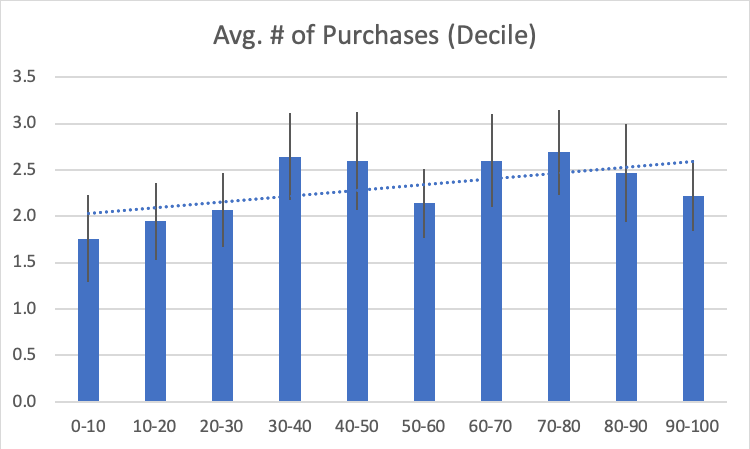
Figure 4: Average number of purhcases by raw SUPR-Q score quintile (top r = .76) and decile (bottom r = .64).
Figure 4 shows a similar pattern to the purchase rate. The average number of purchases increases with higher average SUPR-Q scores when aggregated into quintiles (r = .76; p = .14) and deciles (r = .64; p = .05).
For example, of the participants who rated their original website experience in the lowest quintile, the average number of purchases reported in the subsequent 30–90 days was 1.9 compared to 2.3 for participants in the highest quintile.
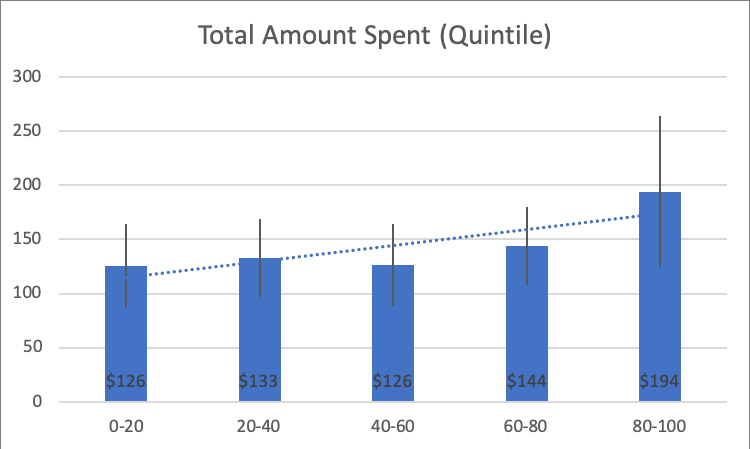
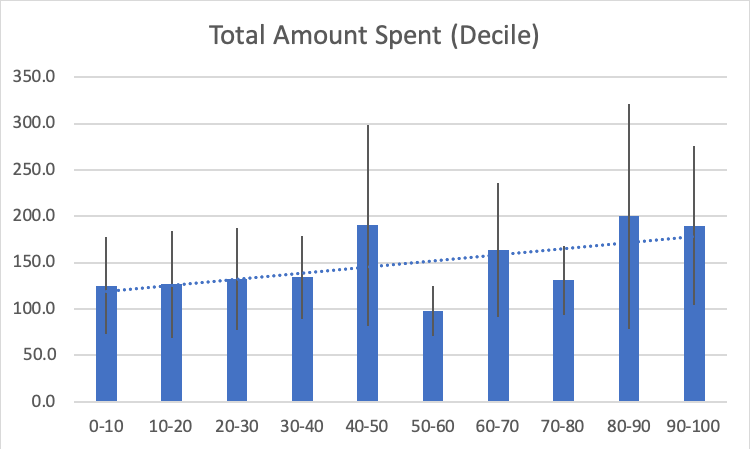
Figure 5: Average amount spent (trimmed) by raw SUPR-Q score quintile (top r = .78) and decile (bottom r = .55).
Figure 5 also shows a similar pattern to the purchase rate and the number of purchases. Unlike in our exploratory study, we now see a pattern with amount spent. The average amount spent also tends to increase with higher average SUPR-Q scores when aggregated into quintiles (r = .78; p = .12) and deciles (r = .55; p = .34).
For example, of the participants who rated their original website experience in the lowest quintile, the average amount spent in the subsequent 30–90 days was $126 compared to $194 for participants in the highest quintile. There is a lot of variability in the data (as shown by the wide error bars in the quintiles) and again an unusual pattern of the average respondents (those with SUPR-Q scores in the 50–60th decile) actually reporting spending less than the lowest scoring respondents (although not statistically). These patterns could be from the heterogeneity in the prices and products on some of the websites.
One problem we found with using the purchase amount was that the type of product/service cost can differ a lot by website. For example, purchasing one airline ticket on United.com may cost $350 compared to a Steam gift card for $10. The total purchase amount would then be substantially higher for a single purchase than multiple smaller purchases.
Even purchase frequency may be misleading as, again, some websites lend themselves to frequent purchases; for example, retail sites such as Walmart.com, compared to travel websites such as Southwest.com. To help control for this we looked for patterns within websites by respondent.
Purchase Behavior By Website
With this larger sample size, we can remove some of the variability among sites by looking at three of the websites that had at least 10 responses (refer to the earlier Table 1). For example, Figure 6 shows the relationship between purchase behavior and SUPR-Q quintiles on eBay (73 responses). Some examples of what people reported purchasing on eBay were:
- iPad 2 cover
- Skincare products from Korean seller
- Fan for my laptop
- Tracfone
- PS4
- Some toys for my mom’s dog
- Pair of shoes
- Flexible foam rollers to curl my hair
- A skateboard and skateboard tool
- Laptop
- Knife
- Video game
- Vitamin supplement
Similar, but stronger, relationships are seen with the eBay data as with the aggregate data. The SUPR-Q averages and reported purchase behavior at each quintile for average purchase rate (r = .37; p = .54; n = 5), number of purchases (r = .74; p = .16), and amount spent (r = .86; p = .06) are shown in Figure 6.
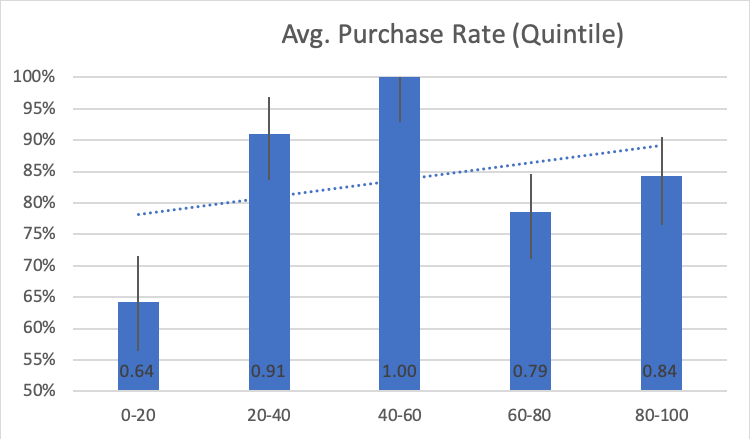
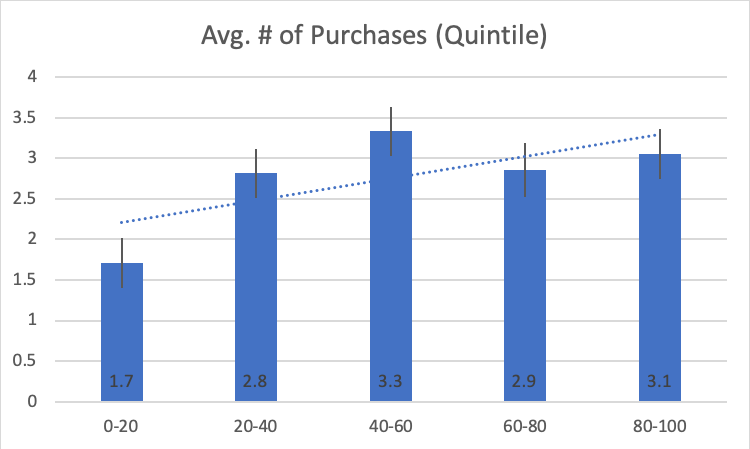
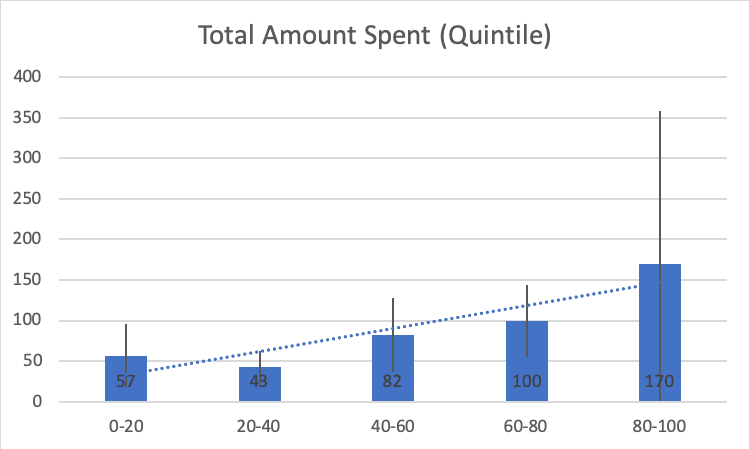
Figure 6: Average SUPR-Q scores by quintile for purchase rate (r = .37), number of purchases (r = .74), and amount spent by raw SUPR-Q score quintile.
For example, eBay users who rated their experience in the highest quintile spent about three times as much ($170 vs $57; p = .32) and purchased about twice as much (3.1 vs. 1.7; p = .06) compared to the lowest quintile.
The sample sizes within each quintile were relatively small (n <= 20) so only the difference in purchase rate is approaching statistical significance. A future study can focus on specific websites with larger sample sizes to confirm these patterns.
The pattern seen with eBay is also seen with Walmart and Target. The extremes are often a better predictor of behavior than the mean. However, there is still somewhat of a linear trend in the data (the figures show the upward sloping trend lines) so the correlation can still be an informative (albeit crude) description of the relationship.
Correlations between SUPR-Q quintiles and purchase behavior by website and in aggregate are shown in Table 2. For example, the correlation between the average number of purchases and SUPR-Q quintiles is r = .74 at eBay, r = .45 at Walmart, r = .43 at Target, r = .76 across all websites by quintiles, and r = .64 by decile.
| eBay | Walmart | Target | All Websites (Quentiles) | All Websites (Deciles) |
|
|---|---|---|---|---|---|
| Purchase Rate | 0.37 | 0.29 | 0.62 | 0.78 | 0.57 |
| Avg. of Purchase | 0.74 | 0.45 | 0.43 | 0.76 | 0.64 |
| Avg Spent | 0.86 | 0.80 | 0.42 | 0.78 | 0.55 |
Table 2: Correlations between SUPR-Q quintiles and purchase behavior by website and in aggregate (including deciles for aggregated websites).
Poor Experiences Portend Less Purchasing
As Figures 3 through 6 show, some of the largest—or at least most predictable—differences are between the extreme responses: the top 20% and bottom 20% by purchase behavior. For example, as we saw earlier, participants with the best experience on eBay spent almost three times as much (199% more) than those with the worst experience (bottom 20%). This pattern is also seen on Walmart, Target (to a lesser degree), and across all websites in aggregate. Participants with the best experience spent 54% more in the future than those with the worst experience across all websites (Table 3).
| eBay | Walmart | Target | All Websites | |
|---|---|---|---|---|
| Purchase Rate | 31% | 14% | 12% | 22% |
| Avg. # of Purchase | 78% | 41% | 5% | 25% |
| Avg Spent | 199% | 119% | 6% | 54% |
Table 3: Difference in purchase behavior between the top and bottom quintile experiences. For example, users who rated an experience in the top quintile spent 54% more.
As Figures 3 through 6 also show, purchase behavior doesn’t uniformly increase. In some cases, the middle quintiles (average relative to this group) have higher purchase rates and more money spent than the highest quintiles. This could be from the nature of the data or evidence of asymmetry. We selected participants who already purchased from the site, meaning they may already have a more favorable attitude, which may be artificially restricting the range and causing these patterns. A future analysis can examine a wider range of experiences to see whether this pattern holds. It may also be that average and good experiences are less predictive than the worst experiences. Website participants may continue purchasing from websites so long as the experience isn’t horrible. Future analyses can also investigate this asymmetry and expectation.
Prediction is hard but these results are quite interesting and encouraging. It suggests attitudes toward website experiences foreshadow behaviors. Generally, a bad user experience is a harbinger of less spending.
This study lends credence to the practice of measuring user attitudes using standardized questionnaires, which can be easier to measure than purchase behaviors. While this analysis used the SUPR-Q, it’s likely other standardized questionnaires (such as the SUS or PSSUQ) can predict future behaviors (something a future analysis can examine).
Summary and Discussion
This article described the results of a longitudinal study that examined the relationship between UX attitudes (SUPR-Q) and future purchasing behavior from 525 respondents over a 90-day period. We found:
Poor experiences portend less purchasing. In general, participants who had a poor experience on a website they recently purchased from are less likely to purchase on it again, purchase fewer times, and spend less than those with the best experiences. This was seen both in aggregate across all websites and within three websites that had the largest sample sizes. This also corroborates the findings in our earlier exploratory study that also found that lower SUPR-Q scores (when aggregated) tend to predict lower purchase rates and number of purchases. While higher SUPR-Q scores are also associated with higher purchases, the affect on purchase behavior is most pronounced with the poorest experiences. This provides strong evidence for the predictive validity of the SUPR-Q, and possibly other standardized UX questionnaires.
Better experiences may lead to more purchasing. The effects of a website experience are likely asymmetrical. Poorer experiences may have a larger impact on behavior (less purchasing) than very good experiences. However, this analysis also found that participants who reported the best experiences (highest SUPR-Q quintiles) spent 54% more and purchased 25% more than participants who had the worst experience (lowest SUPR-Q quintiles) across all websites. This was also seen within websites, especially participants who used Target and eBay where users with the best experiences spent two to three times more than those with the worst experiences.
Aggregating helps reveal relationships. It can be difficult to predict specific behaviors but easier to find patterns when data is aggregated. We found that aggregating SUPR-Q data into both quintiles and deciles and in looking within some websites, we were better able to identify nonlinear associations, especially with more extreme attitudes. The correlation between SUPR-Q quintiles and purchase rates averaged around r = .78, showing a strong relationship using this aggregation method. That is, if a single person has a bad experience on a website, it’s harder to predict whether they will spend less money or even not purchase again. In contrast, we can say with more confidence that if people have a poor experience then, in general, they will tend to spend less money and be less likely to purchase again.
Extremes predict more than means. This analysis corroborated what we’ve seen in earlier research and from other published studies—the most extreme responses tend to be a better predictor of behavior than the mean responses. Across all websites, participants with the best experiences (top 20% SUPR-Q scores) spent 54% more in the future than those with the worst experiences.
Recent purchases may restrict correlations. While this analysis included a wide range of websites, we may have restricted the range of experiences to generally better ones because participants rated websites they recently purchased from (and therefore have a more favorable attitude toward). We didn’t include data from websites people hadn’t purchased from that would likely include lower SUPR-Q scores. A future analysis can include data from participants who had visited but not purchased from the website to see whether the purchase behavior differs.
We didn’t establish causation. This analysis didn’t identify causality between UX and purchasing. With the data we collected, we can’t say that a better UX causes people to purchase more. We can only say that higher purchases are associated with better UX. To show causation, we need to have correlation, temporal precedence (attitudes come before purchases), and isolate other causes. We’ve done two (higher scores precede and are correlated with higher self-reported purchases), but it could be that people who purchase more on websites think the experience is better and continue purchasing. A future randomized controlled experiment may help disentangle confounding effects.
Self-reported data may be inaccurate. As is commonly done in behavior research, we’re relying on participants to self-report the number of purchases and the amount of money spent. With self-reported data, participants could be inaccurate in recalling how much money they spent and whether they purchased, which adds error to our associations. For example, when self-reported purchase data is collected at the same time as attitudinal data, participants may increase their purchase amounts in conjunction with higher UX scores (thus inflating the correlations). The advantage of the longitudinal services taken in this study is that we collected the SUPR-Q data first, then collected the self-reported purchase data 30–90 days later, likely reducing the systematic inflation of correlations. But even that’s not good enough for us. A future article will analyze how reliable this self-reported purchase data is and to see how it may impact the association with UX metrics.

")
")