 Online panels are a major source of participants for both market research and UX research studies.
In an earlier article I summarized some of the research on the accuracy and variability of estimates from online panels.
The types of estimates from those studies tended to center around general demographic or psychographic questions (e.g., smoking, newspaper readership).
To understand whether similar findings would hold for UX-related metrics, we conducted our own studies and continued to examine the accuracy and variability from estimates obtained across online panels.
One of the findings of the earlier research was that external benchmarks (such as election outcomes or home ownership rates) provide good means for assessing the degree of accuracy for online panels.
Unfortunately, most UX measures we studied don’t have external benchmarks (e.g. there is no official external usability score), which make it harder to gauge the accuracy of the estimates from online panels. We can, however, look at the variability between panels to see how metrics vary. To do so, we conducted four studies using multiple panels and measures.
Study 1: SUPR-Q Scores for Target.com on Three Panels
In the first study we looked at three non-probability panel sources: Amazon’s Mechanical Turk (MTurk), Google Surveys, and SurveyMonkey. We recruited participants who said they had been to the Target website in the last six months and had them answer the 8-item SUPR-Q. We collected between 50 and 100 responses from each panel. The percent differences in SUPR-Q scores are shown in Table 1.
| Panel Comparison | Target.com % Difference |
| MTurk & SurveyMonkey | 2.1% |
| MTurk & Google Surveys | 9.1% |
| SurveyMonkey & Google Surveys | 7.1% |
| Average | 6.1% |
Table 1: Absolute percent difference in SUPR-Q scores for recent visitors of the Target.com website for three panels.
On average we found a 6.1% difference between the SUPR-Q scores we obtained depending on the panel. MTurk and SurveyMonkey Surveys had similar results, differing by only 2.1%. Google Surveys however diverged the most from both panels with differences of 7.1 and 9.1%.
Study 2: SUPR-Q for Amazon on Two Panels
We repeated the small study and collected data from a new set of participants who had been to the Amazon website recently. (Mechanical Turk was excluded due to the potential bias of respondents.) The difference between SurveyMonkey and Google Surveys was even larger this time—a 12% difference.
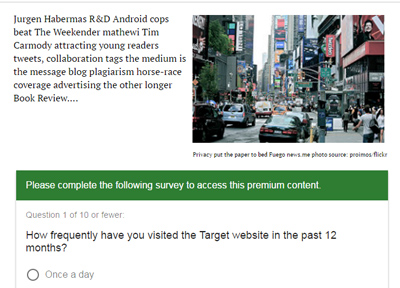
We suspect one of the reasons for the larger divergence from Google Surveys is how Google collects its responses. Google Surveys collects data by embedding questions on webpages and imposing a sort of survey wall. For website visitors to proceed, they have to answer a survey of 10 questions (see Figure 1).

Figure 1: Google Surveys survey wall example.
We suspect this interruption generates more satisficing compared to data from MTurk and SurveyMonkey where participants are opting in to take a survey and are directly compensated. More research is needed to see whether Google Surveys continues to differ and if it’s a result of its sampling method.
Study 3: SUPR-Q & NPS Scores for 10 Retail Websites on Two Panels
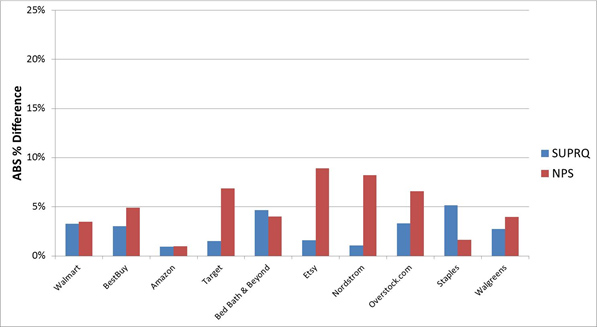
In a larger study with 806 participants, we compared SUPR-Q scores for ten retail websites (e.g. Walmart, Best Buy, Etsy). The only screening criteria was that the participants had to have been to the website in the last six months. Roughly half the participants were collected from Amazon’s Mechanical Turk and half from our favorite non-probability panel company, Op4G. Figure 2 shows the results.

Figure 2: The absolute percent difference in SUPR-Q and Likelihood to Recommend (NPS) scores between participants from Mechanical Turk and Op4G.
Figure 2 shows the absolute percent difference in SUPR-Q scores and Likelihood to Recommend question (for the NPS) for the two panel sources. For example, the difference in raw scores from Walmart SUPR-Q scores from the two panels are (4.23-4.09)/4.23=.033 or 3.3%. The mean absolute difference is surprisingly small at 2.7% across all ten websites for SUPR-Q scores and 5.2% for LTR scores. The higher variability between NPS scores is somewhat expected as it’s based on only a single item compared to 8 for the SUPR-Q.
Study 4: Online Shopping Attitudes and Behaviors for Two Panels
In another study involving 2000 participants from Harris Interactive’s panel and 1000 from Op4G’s panel, participants were asked a number of intent and attitude questions about online and offline shopping habits. In total, data was collected on 117 items that asked participants to rate, rank, and select the importance of certain website features, how and why they do and don’t use them, and questions about past and future shopping behavior, including likelihood to recommend a website or store.

Figure 3: Distribution of the absolute difference in scores between the Harris and Op4G panels.
Figure 3 shows the distribution of the absolute difference in scores between the Harris and Op4G panels. The median absolute percent difference across the 117 items was 10%.
In some respect, the percent difference might overstate the magnitude of the difference observed as it includes rating scale data and binary choices. For example, one item asked participants if they used a particular feature on the website. Eight percent of participants from Harris selected the item compared to three percent from Op4G. While that represents only a five percentage point difference, it is a 63% difference (.08-.03)/.08=.625.
Summary
This article extended the findings from the literature review by adding data from four of our own studies across multiple non-probability panels and metrics. Here are some takeaways:
UX metric estimates vary, but not as much as we expected. The point estimates for UX metrics varied between panels as they did for more general demographic and psychographic variables. On average the differences were between 3% and 10% but in some cases exceeded 20%. This was less than we expected given the more ethereal nature of UX metrics.
SUPR-Q scores varied less. The average differences in SUPR-Q scores across the ten websites were less than 3% and rarely exceeded 5%. While small differences in UX attitudes can matter, for the most part, differences of this size will likely have a small impact on decisions.
Watch Google Surveys. We were disappointed with our experience using Google Surveys as it differed more substantially from the other panels for the SUPR-Q items. We think this is a function of coercing people (take the survey to see an article) but more research is needed to see the strengths of this panel source.
How precise do you need to be? For some studies, a 3% to 20% amount of uncertainty (on top of sampling error) is enough accuracy; in other cases, differing by 10%, 5%, or even 3% can mean making different decisions. Know how much uncertainty you can tolerate.
Don’t change panels. Continuing the recommendation from the earlier research: Pick a panel and stick with it when tracking data over time, such as likelihood to recommend a product or brand attitudes. Differences between panels can in many cases exceed real differences in the population.
Comparisons often matter more. This study focused on point estimates. In many user and customer research studies we aren’t interested in pinpointing an absolute number (the point estimate); we’re often more interested in differences between stimuli (e.g. tasks and websites), over time (such as before and after changes), or understanding the root cause of attitudes (e.g. key drivers of likelihood to recommend).
Indeed, much of the findings in peer-reviewed behavioral sciences journals come from non-probability sources: undergraduate psychology students. And while there are some concerns about the generalizability of these studies, many important findings have been reported and replicated.
Future research will examine how well non-probability samples do when making comparisons or establishing causation for both UX data and more general market research data.


