 Users’ attitudes about an experience affect their future behavior.
People who think a website is less usable or less attractive will probably visit less, purchase less, and recommend the website less.
Understanding users’ attitudes now (easier to measure) can help predict users’ behavior in the future (harder to measure).
At least that’s the idea behind using standardized questionnaires such as the SUPR-Q.
But there’s actually not a lot of evidence showing UX measures predict future behavior. That’s one of the reasons we’re on a mission here at MeasuringU to find and fund studies that help understand the validity (or lack thereof) between our methods and metrics. Getting there first means understanding the best ways to find and quantify relationships between attitudes and behavior—something that’s been the topic of studies in the behavioral sciences for decades.
Earlier we found evidence that the SUS does correlate with future growth in the software industry.
And when validating the SUPR-Q I cited a few studies [pdf] that provided a link (albeit a tenuous one) between measures of UX and website behavior. For example, poor navigation discourages purchasing, whereas better navigation can increase average order value.
Both datapoints support the very reasonable idea that, generally, participants like better user experiences.
But a good way to understand the predictive ability of UX questionnaires, such as the SUPR-Q, is to see how the same people’s UX attitudes predict their behavior over time—that is, longitudinal research. This involves tracking one user’s attitude, following up in the future to understand behaviors (e.g. purchases), and seeing how well the SUPR-Q predicted the outcome (if at all).
Longitudinal studies take time (hey, “long” is in the name!) and aren’t easy because you have to keep track of people and the inevitable attrition rates. (It’s hard getting people to respond to one survey, never mind two!) Here is the result of a two-year longitudinal pilot study we conducted to better understand how to identify the link between UX attitudes and future behaviors.
Longitudinal Study: 2013–2015
In Q4 2013, we collected data for a benchmark study on 10 retail websites and included SUPR-Q data from 800 participants. Approximately two years later (Dec 2015 to Jan 2016) we reached out to 125 participants who provided their contact details and indicated it would be okay to be contacted about their results. We invited these participants to complete a follow-up study and asked them about their subsequent experience on the website they had rated: specifically, how many purchases they made and how much money they spent on the website in the prior 12 months. We received 24 completed responses (a 16% response rate) for seven websites (see Table 1). It’s a small sample but still large enough to explore potential relationships between UX attitudes and behaviors on websites.
| Website | Sample Size |
|---|---|
| Staples | 6 |
| Bed Bath & Beyond | 4 |
| Walgreens | 4 |
| Walmart | 4 |
| Crate & Barrel | 3 |
| Overstock | 2 |
| Amazon | 1 |
Table 1: Websites and number of respondents per website for the follow-up survey.
Most respondents reported making a purchase in the prior year (83%) and the median number of purchases was 2, with a wide range of 0 to 100 (the high being from the one Amazon respondent). The median spent per website was $115, also with a wide range of $0 to $1500 (again this was for the Amazon respondent).
To assess the predictive validity of the SUPR-Q, we can use the simple correlation. The correlation between individual SUPR-Q scores and number of purchases is a small r = .18. At a sample size of 24 this correlation isn’t statistically significant (p = .39). The correlation between the average amount spent and SUPR-Q scores is also not statistically significant and small: r = -.13; p = .60. (It’s also going in the wrong direction!)
As is often the case with prediction and social science research, we may need to dig deeper to understand patterns (or lack thereof) as absence of evidence doesn’t always mean evidence of absence. Errors in how we measure attitudes and behavior can mask relationships.
There are at least three well-documented challenges to using the correlation as a measure of predictive validity: linearity, range restriction, and non-aggregated data.
Linearity
Correlation (the kind you typically hear about) works best when the data is roughly linear and normally distributed. A visual inspection of the distribution of purchases and purchase amounts reveals a heavily skewed distribution (see Figure 1).
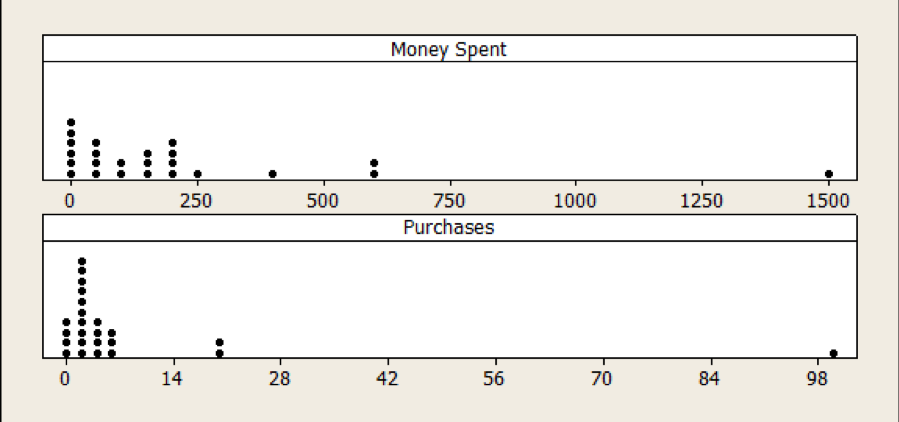
Figure 1: Distribution of money spent and number of purchases made in the prior year (self-reported) on a website is positively skewed, likely affecting the correlation between SUPR-Q and purchase and amount spent.
Removing the one large purchase not only intensifies the negative correlation (r = -.38; p = .06), but also produces a more expected pattern as shown in Figure 2 with r = .31 and p = .15, but it’s still not a statistically significant result.
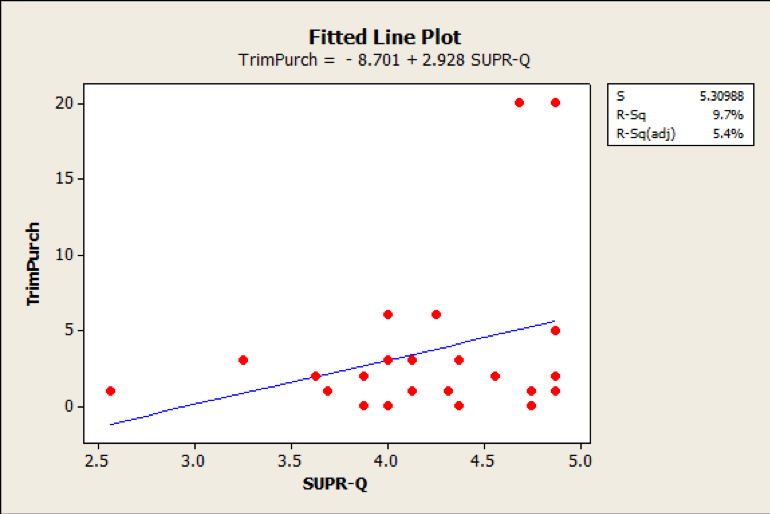
Figure 2: There is a slight, but not statistically significant, relationship between SUPR-Q scores and future number of website purchases (after removing one large purchase).
Range Restriction
A wide range of responses is best for detecting differences. The range of SUPR-Q scores and reported purchase history here may be too narrow. There is still some variability; the lowest scoring experience was very low (at the 1st percentile) but most scores were high, with 75% being above average. A larger sample size with more variability at the low end may help identify the relationship.
Aggregation
It can be very difficult to predict individual instances of behavior from a general measure of attitude (e.g., one person’s attitude about exercise can predict whether they will exercise in a given period). However, when data is aggregated, you can predict patterns of behavior (many people’s attitudes about behavior predicting average actual exercising rates). See Ajzen, chapter 4 for a detailed overview of aggregating attitudinal data to predict behavior. But when you have such a small sample size, there just isn’t much to aggregate.
Means vs. Extremes
Earlier we wrote about how often it’s the extremes, not the means, that are a better predictor of behavior. This is why the NPS uses the top-two boxes to predict recommendation behavior (and ultimately growth). Using the top (or bottom) scores is essentially a nonlinear transformation.
One theory is that those who hold average attitudes are generally less likely to follow through on a behavior (for example, visiting or purchasing); whereas those with more extreme attitudes are more likely to act on their beliefs. To identify the extreme respondents, we segmented the responses using the SUPR-Q distribution of scores into five groups:
- Bottom 25%
- Below average (this includes the bottom 25%)
- Above average (this includes the top 25% and top 5%)
- Top 25%
- Top 5%
Because of the small samples, each group is not independent. The below average group contains the bottom 25% and the above average group contains the top 25% and top 5%. However, this transformation allows us to compare below average to above average and top scorers to bottom scorers.
Using the buckets and removing the one large purchase addresses much of the nonlinearity and aggregation problem. We can now see some preliminary patterns from the average SUPR-Q score at each of the five buckets with the average purchases for each bucket. Figure 3 shows these relationships. As expected, we see the makings of relationships. As the SUPR-Q buckets go up, the average purchase rate goes up and the average number of purchases go up. But there doesn’t seem to be a logical relationship between the amount spent per website and SUPR-Q as the highest scoring group is spending LESS than lowest scoring group. This also may just be a consequence of the small sample size used in this exploratory research.
The most noticeable differences are between the extremes—the top 25% and top 5%. For example, the average number of purchases for the top 25% (above the 75th percentile) are eight times greater than the bottom 25%; 16.1 vs. 1.7 (p = .17). The pattern remains, albeit attenuated, for the below average versus above average comparison; 10.6 vs. 1.6 purchases (p = .17). Despite the large differences, because of the high variability and low sample sizes, neither is statistically significant (both have p-values at p = .17).
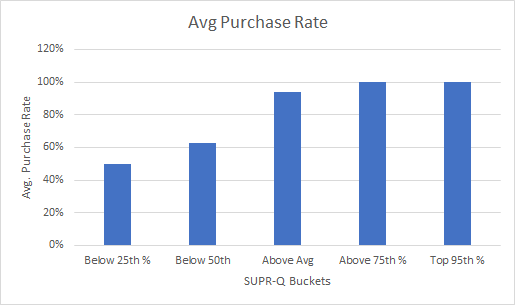

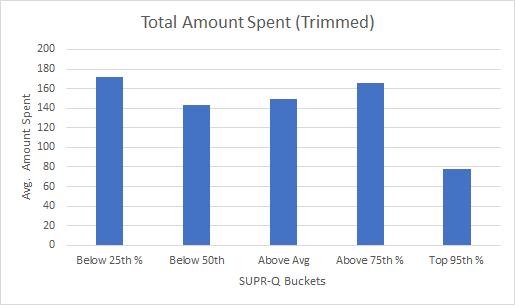
Figure 3: Distribution of purchase behavior by SUPR-Q buckets. Average purchase rate and average number of purchases tend to go up with higher SUPR-Q scores whereas total amount spent goes down.
Differences in the average purchase rate (the respondents did or did not purchase) are however statistically significant for the same comparison (see the top of Figure 3). The average purchase rate for the top 25% is twice as high compared to the bottom 25%, 100% vs. 50% (p = .016). The pattern again remains (with marginal significance) for the below average versus above average comparison in purchase rates, 94% vs. 63% (p = .06).
The average amount spent, however, seems to have no discernible pattern, even after excluding the one high purchase amount ($1500 for Amazon) and using the SUPR-Q buckets. The bottom of Figure 3 shows that the average purchase amount was actually higher for the bottom scoring groups and especially for the top 5% versus the bottom 25%.
There are at least three possible reasons for this result. First, reported purchase amounts may be very high for certain websites (e.g. Crate & Barrel) compared to others (e.g. Walgreens) and may mask the relationship. One way to minimize this heterogeneity effect across sites is to examine purchases within a website, where purchase amounts are more similar. The sample size is too small to do that here but it’s something we’ll look at in a future analysis.
The second reason may simply be that respondents are providing inaccurate reports of how much they spent (but more accurate reports of having purchased). We are asking respondents to think back to the last year and the error in estimation may also be washing out any relationship. We’ll also examine the accuracy of these self-reported purchase rates in a future article.
Third, it could be that attitudes toward a website experience aren’t predictive of future amounts spent—even after aggregating. We do see a relationship with the number of purchases and purchase rates, so it could be that a larger sample is needed to identify a pattern or provide more evidence that purchases amounts are less predictable (at least using self-reports over a one-year period).
Summary and Takeaways
In this article, we examined the data from a two-year longitudinal exploratory study to examine the relationship between attitudes toward UX and future behaviors.
SUPR-Q extremes may predict purchases and purchase rates. The average number of purchases made and the average purchase rate were higher for participants that provided the highest SUPR-Q scores compared to the lowest scores. The average purchase rate for the top 25% is twice as high compared to the bottom 25%, 100% vs. 50%. The average number of purchases for the top 25% was eight times greater than the bottom 25%, but the difference was not statistically significant. (Likely this is a consequence of the small sample size of 24.)
Average SUPR-Q scores may not be as predictive as extremes. This study didn’t find a clear pattern between average SUPR-Q scores and purchase rates and average number of purchases. Likely reasons for the lack of correlation are nonlinearity in purchases, disaggregated data (it’s harder to predict one person’s purchase behavior compared to a group), and the means’ being a poorer predictor of future behavior than extreme responses, as other research has shown.
Purchase amounts aren’t well predicted despite transformations. Even with aggregation and removing the influence of extreme values, we didn’t find a clear pattern of SUPR-Q scores predicting reported purchase amounts. This could be because of heterogeneity across websites (e.g. Crate & Barrel purchases cost more than Walgreens), errors in self-reporting, the smaller sample size or that purchase amounts aren’t predicted by UX attitudes.
More research is needed (and planned). We consider these results as preliminary. The small sample size and long duration (two years) may mean the results are less representative. In an upcoming article, we will look to see how well these early patterns hold in another longitudinal study we are conducting with a larger sample size over a shorter time frame.
