 To understand problems on a website, nothing quite beats watching users. The process provides a wealth of information both about what users can or can’t do and what might be causing problems in an interface.
The major drawback to watching users live or recordings of sessions is that it takes a lot of focused time. 5 to 20 participants—the typical sample size in moderated studies—isn’t too much of a commitment.
But with unmoderated studies, the ability to collect data from hundreds of participants quickly means even a few tasks per study requires watching thousands of videos.
While there won’t be a replacement for watching session recordings and coding them (something our research team does regularly), we’re always looking for more systematically and quicker ways to identify patterns in behavior.
We’ve found that a few metrics automatically collected in unmoderated studies are good for diagnosing potential problems with websites. The MUIQ research platform collects these metrics for every page visited and summarizes them by page (see Figure 1 below and Figure 2 at the end of the article below). Here are the five metrics in more detail.
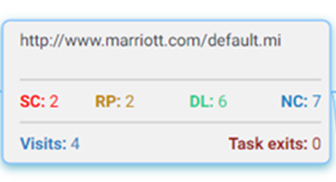
Figure 1: Key metrics summarized on each page of an unmoderated study (in this example from a Marriott benchmark study).
1. Clicking on Non-Clickable Elements (NC)
In the early days of the web, websites were littered with “click here” links, in part to help users know, well, where to click. While we’ve come a long way since then (for the most part), some websites and pages still suffer from an affordance problem: people not knowing what elements are clickable (see the video below). It can be images, links, headings, or the page background that gets clicked or overlooked. Tracking how many non-clickable elements were clicked shows when participants don’t know where to click.

Video Clip 1: A participant clicking on a non-clickable element on a website.
2. Rapid or Repeat Clicking (RP)
A related issue to clicking non-clickable elements is when participants double- or triple-click elements. This can be a symptom of latency (pages not responding) or even carryovers from desktop behavior where double-clicking is a common action. What’s more, rapid clicking can be an indication of participant frustration. Some have called this rage clicking where website users become frustrated and start clicking indiscriminately (and often on non-clickable elements). The video below illustrates the behavior this metric summarizes.

Video Clip 2: A participant rapidly clicking (“rage-clicking”) on a non-clickable element on a website.
3. Scrolling, or lack thereof (SC)
Not all essential elements (content, products) can be shown on one page or “above the fold.” Scrolling is usually inevitable and increasingly so with the design trend of long or infinite scrolling pages.
But scrolling doesn’t always happen. Tracking the percentage of users who click a key call-to-action (CTA) or find information that is lower on a page can reveal a lot about how effective the design and content are, as well as who may or may not be digesting it.
4. Click Latency (DL)
The opposite of rapid clicking is long delays between clicks. While long delays don’t always mean a problem exist, it can be another symptom of users potentially struggling to navigate within pages, possibly on non-clickable elements or taking time to make decisions on a page.
5. Task Exits
Knowing how many participants land on certain pages and the paths they take is helpful by itself (this is the “Visits” metric in Figure 1). But often as telling is where participants exit or give up on a task. The “Task exits” metric reveals where participants end their experience—for better or for worse—and again provides an idea about where the page navigation isn’t meeting expectations.
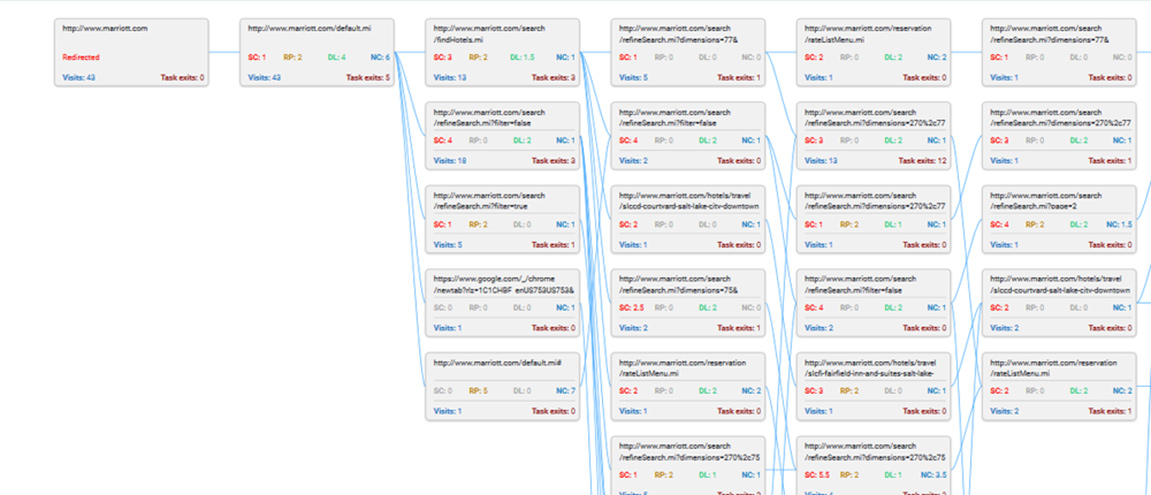
Figure 2: The navigation paths of participants in an unmoderated study on Marriott.com. Each page summarizes key metrics to diagnose potential problems on a page (from Figure 1). Note: Writing is not meant to be legible in this figure (see Figure 1).
Summary
Some common metrics summarized by page can help quickly identify pain points with website content or navigation in unmoderated studies. These metrics include clicking non-clickable elements, rapid “rage” clicking, scrolling (or not), delayed clicks, and page exits. While these metrics are no substitute for watching videos of participants interact with a website, they can both speed up the process and help focus efforts on areas where more investigation is needed.


