 In an earlier article, we demonstrated how it’s completely permissible from a statistical perspective to report numbers when studies have very small sample sizes (fewer than ten people).
When you use numbers, you can present them as raw numbers, fractions, or percentages. You can present them in a report, on a train, or on a plane.
If five participants in a sample of seven people encountered a problem booking their flight, you can quantify the frequency of this issue in several ways:
- 5 (simple count)
- 5/7 (fraction)
- 71% (percentage)
- 5 (71%) (simple count + percentage)
- 5/7 (71%) (fraction + percentage)
Perhaps you’re OK with using numbers, but maybe you’re less comfortable using percentages computed from small samples because of pushback from colleagues. But is there a downside to avoiding percentages? Do readers have a harder time interpreting raw numbers and fractions? For example, what happens when you need to compare results with differing numbers of participants?
To find out, we ran an experiment using the MUiQ platform.
Fractions vs. Percentages Experiment
In this experiment, we assessed how easily participants could compare fractions or percentages.
In October 2023, we invited 200 participants from a U.S.-based online panel to take part in a study in which they saw two numbers expressed as fractions or percentages and selected the larger one. Figure 1 shows examples of the comparisons presented to participants.
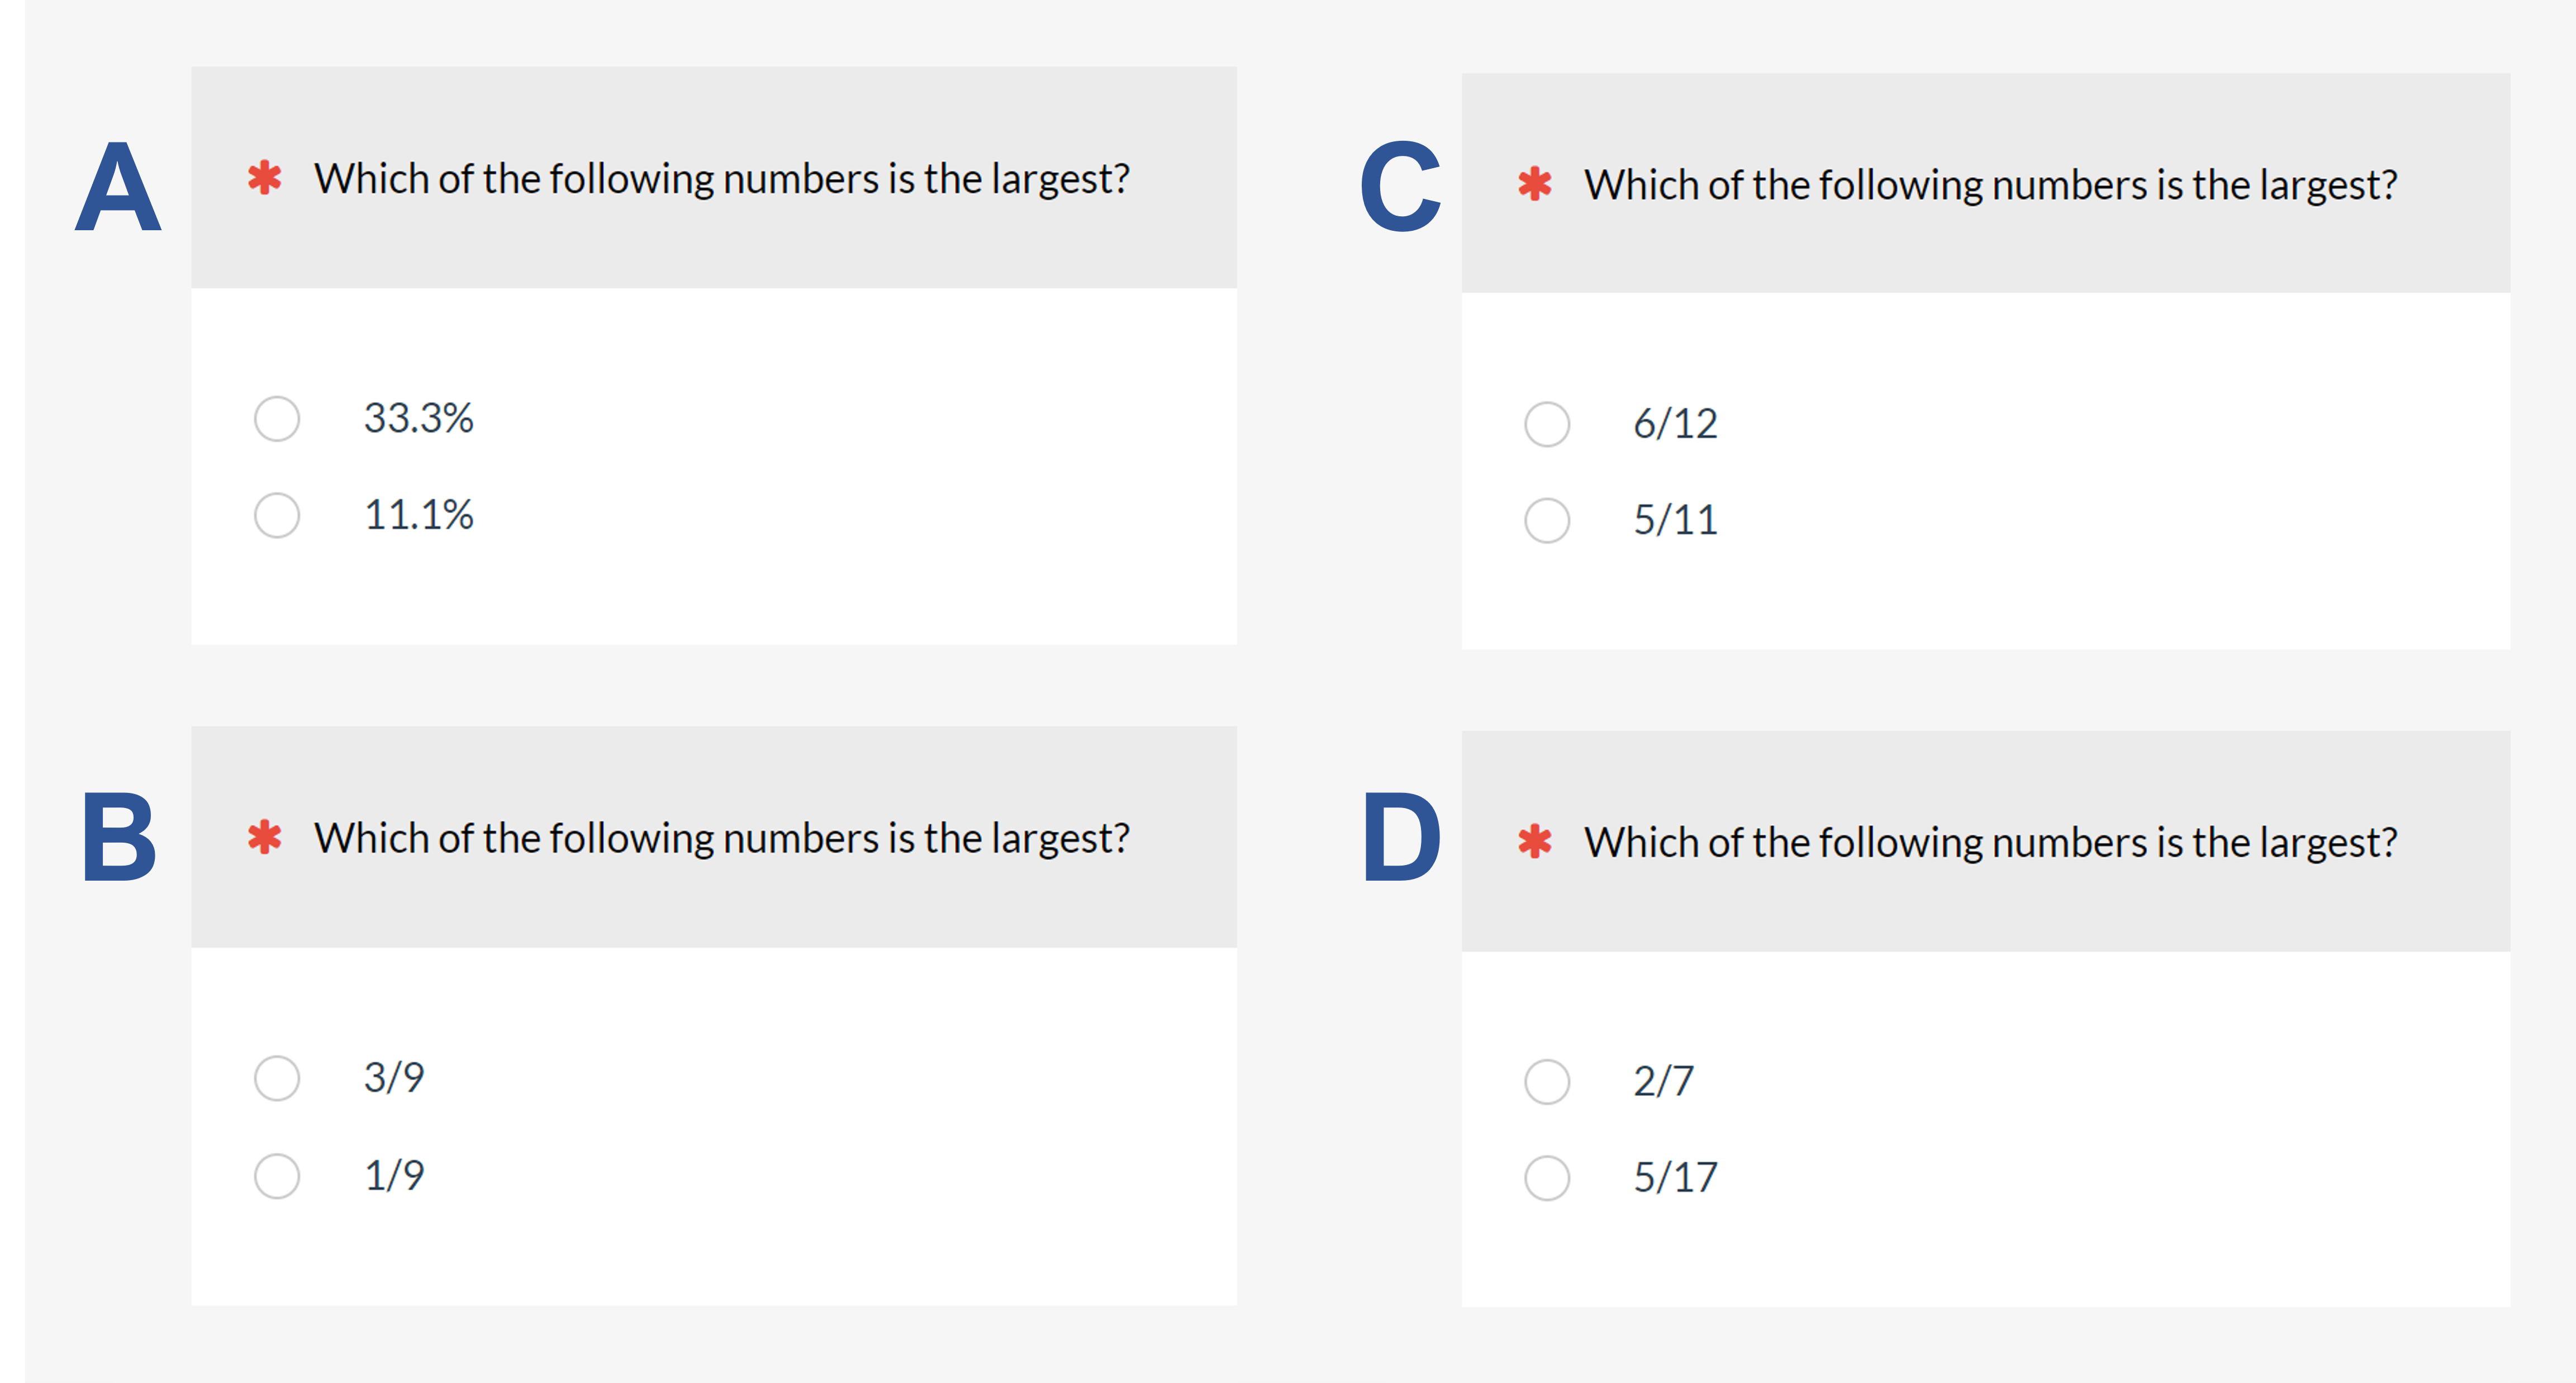
Figure 1: Four examples of comparisons used in this experiment.
Examples A and B have the same magnitudes, presented as percentages in A and fractions in B. Examples B, C, and D vary in the size of their differences (D < C < B) and whether the fractions being compared have the same denominator (B) or different denominators (C and D).
Table 1 shows the full experimental design for this study. Eight problems were presented to participants, either as a fraction (Version a) or as a percentage (Version b), for a total of 16 comparisons.
We apologize if this experiment gives you flashbacks to fourth-grade math.
The table shows which numbers were presented first and second in a comparison, the absolute magnitude of the difference between the numbers, whether when presented as a fraction the denominators of the numbers being compared were the same or different, whether the magnitude was a small or large difference, and whether the larger number was presented first or second.
| Problem | First | Second | Magnitude | Denominator | Difference | Larger |
|---|---|---|---|---|---|---|
| 1a | 11/12 | 10/12 | 8.3% | Same | Small | First |
| 1b | 91.7% | 83.3% | ||||
| 2a | 6/12 | 5/11 | 4.5% | Different | Small | First |
| 2b | 50.0% | 45.5% | ||||
| 3a | 2/7 | 5/17 | 0.8% | Different | Small | Second |
| 3b | 28.6% | 29.4% | ||||
| 4a | 6/9 | 2/10 | 46.7% | Different | Large | First |
| 4b | 66.7% | 20.0% | ||||
| 5a | 3/9 | 1/9 | 22.2% | Same | Large | First |
| 5b | 33.3% | 11.1% | ||||
| 6a | 16/19 | 17/19 | 5.3% | Same | Small | Second |
| 6b | 84.2% | 89.5% | ||||
| 7a | 3/5 | 5/5 | 40.0% | Same | Large | Second |
| 7b | 60.0% | 100.0% | ||||
| 8a | 3/8 | 7/13 | 16.3% | Different | Large | Second |
| 8b | 37.5% | 53.8% |
Table 1: Experimental conditions.
We designed this experiment to allow the assessment of four main effects (two levels each) and their interactions:
- Format: Fraction or percentage
- Denominator: Same or different
- Difference: Small or large
- Larger value: Presented first or second
For each problem, we measured whether respondents selected the correct answer (accuracy) and the time they took to make the selection (speed).
Results
The experimental results include performance (accuracy, speed) and preference outcomes.
Performance Results
Figure 2 shows the accuracy and speed results for the 16 comparisons. By far the biggest effect we found was that people make a lot more mistakes when comparing fractions when the denominators are not the same (Figure 2).
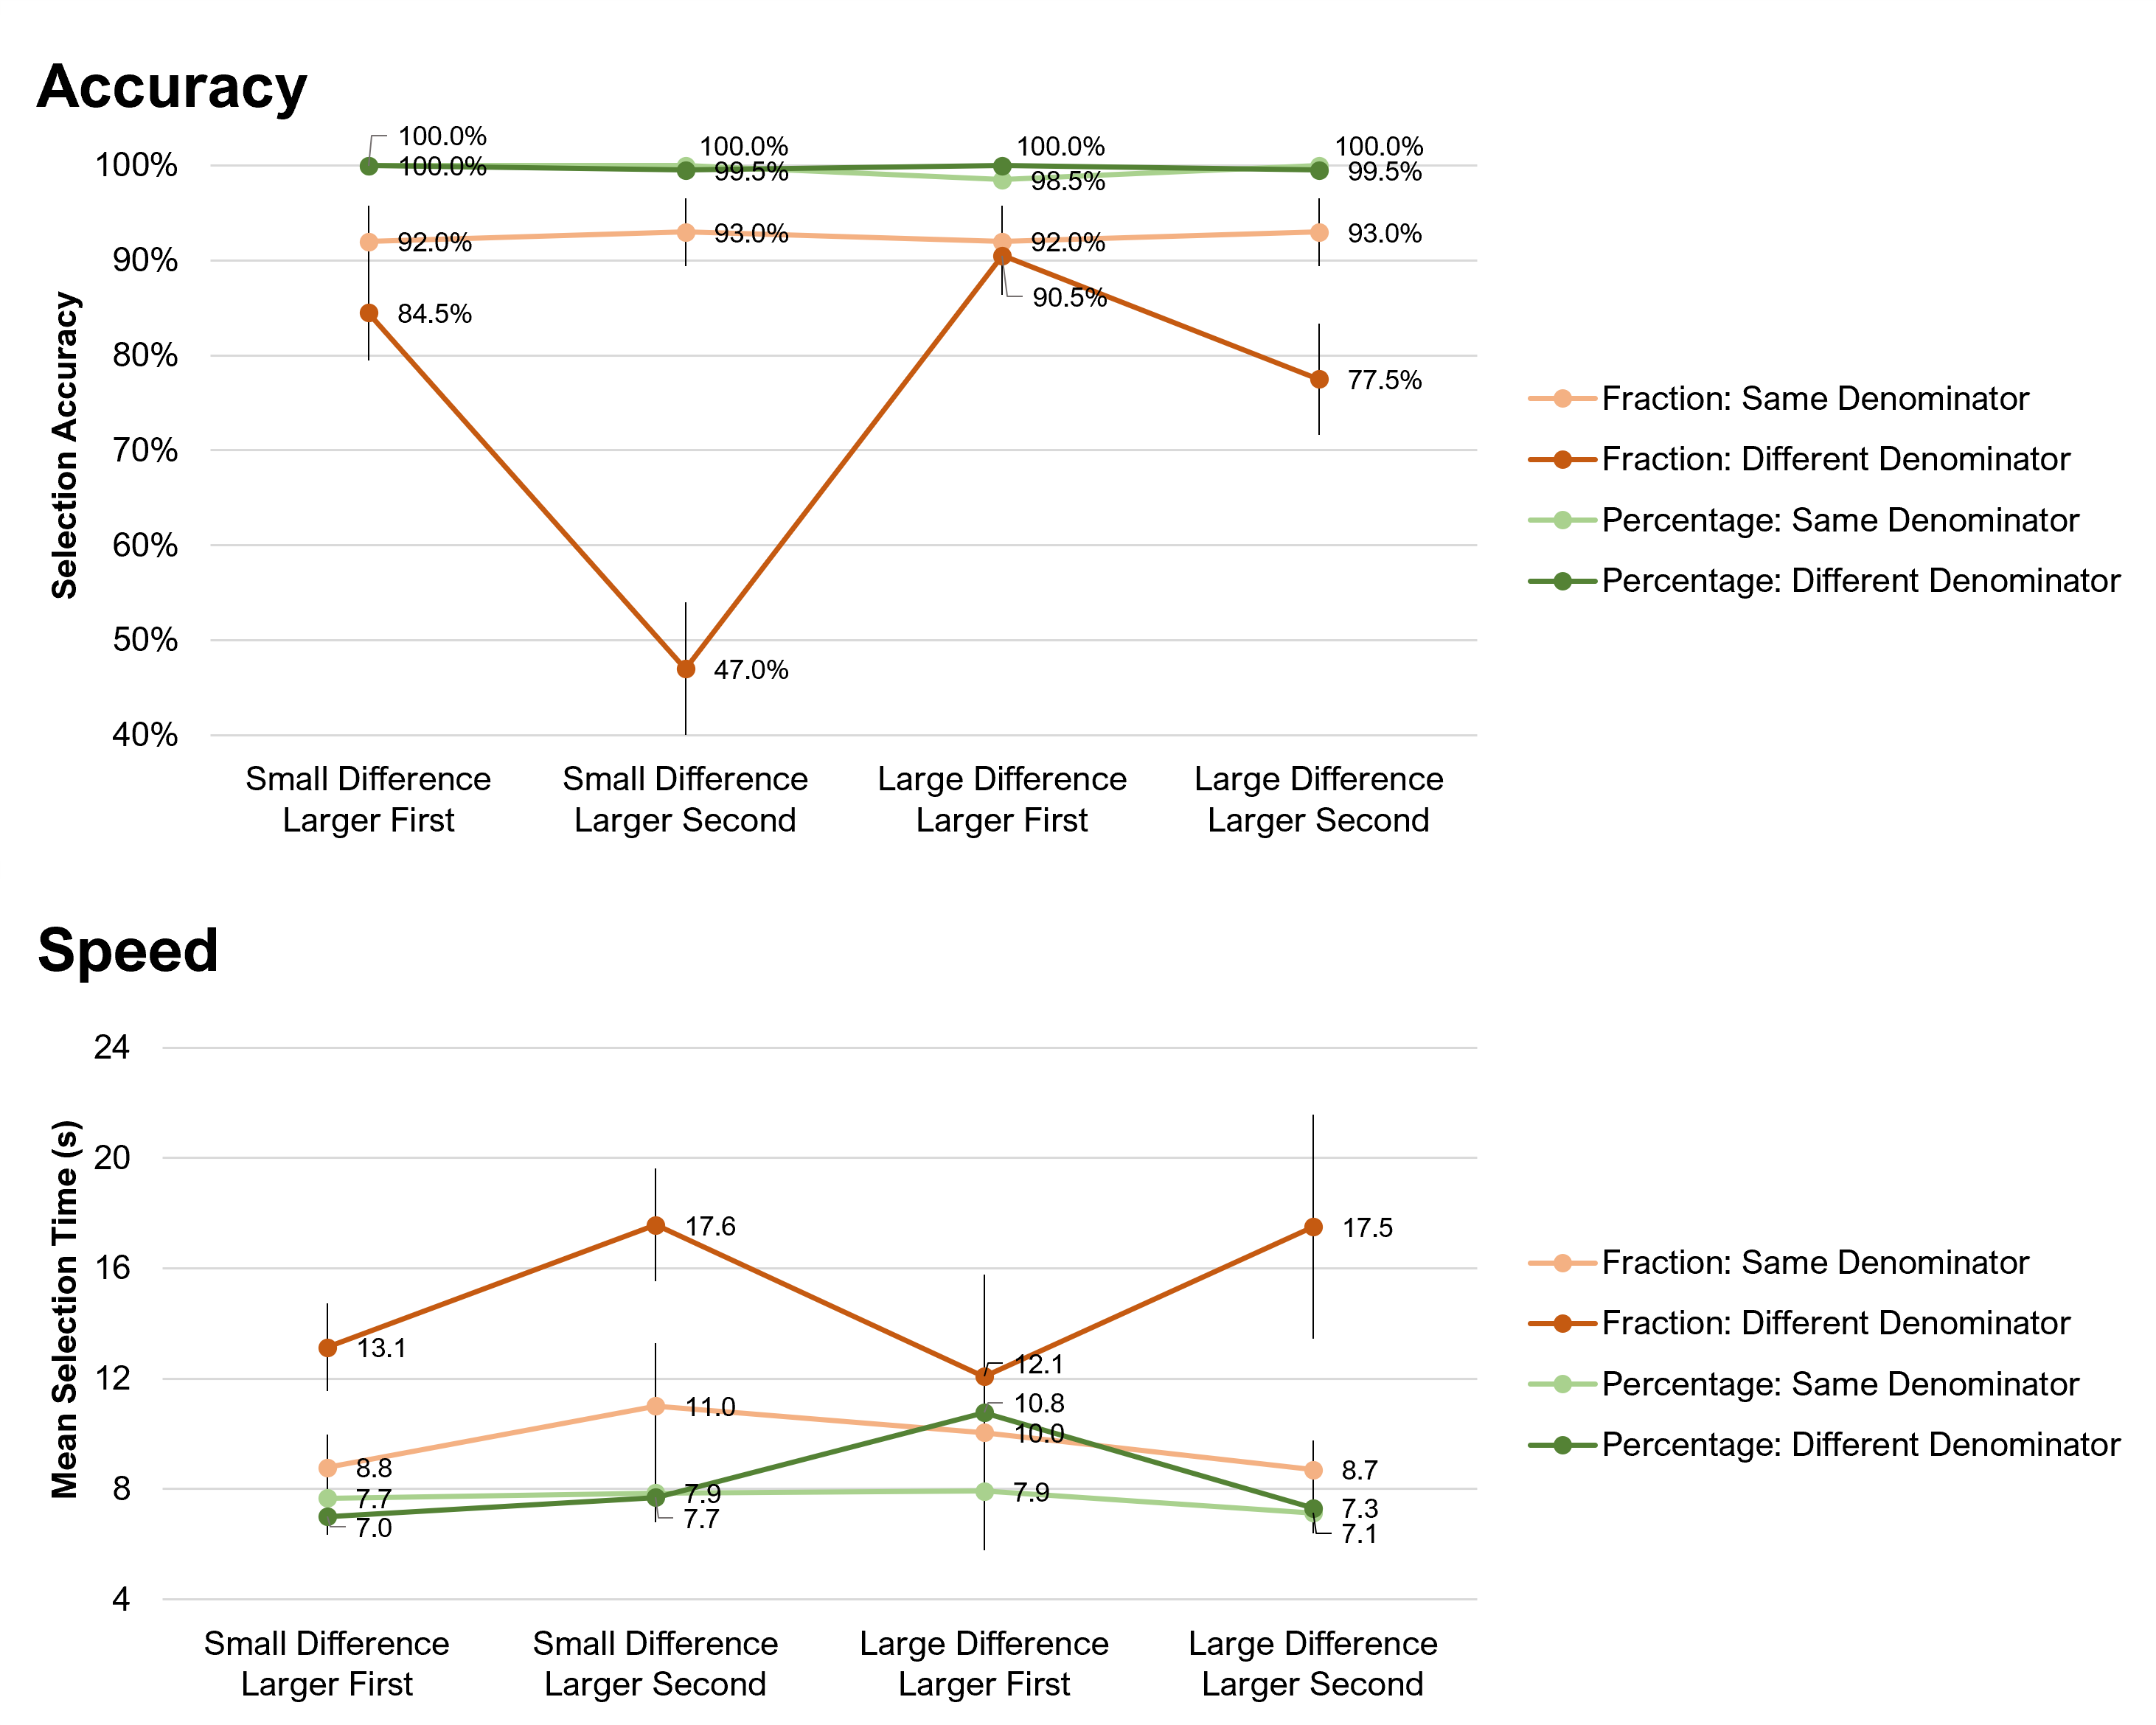
Figure 2: Accuracy and speed results.
We dug into the results more and ran repeated ANOVAs for both accuracy and speed data, finding significant four-way interactions (Accuracy: F(1, 199) = 24.8, p < .0001, partial η2 = .11; Speed: F(1, 199) = 4.5, p = .035, partial η2 = .02).
Figure 2 illustrates several key results:
- Judgment accuracy was nearly perfect for percentages, scoring significantly higher than fractions across all experimental conditions.
- Judgment accuracy was poorest for fractions with different denominators. For one comparison, fewer than half of the respondents got the correct answer!
- Judgment accuracy for fractions with the same denominator was significantly poorer than accuracy with percentages, but still relatively high (> 90%).
- The advantages of percentages and disadvantages of fractions with different denominators were not the result of a speed–accuracy tradeoff because response times for percentages were faster than those for their respective fractions for all eight problems.
While analyzing these data, we noticed that when denominators were different, the magnitude of the difference between denominators seemed to affect selection accuracy and speed for those fractions. Figure 3 shows the results of this mini-experiment contained within the larger experiment.
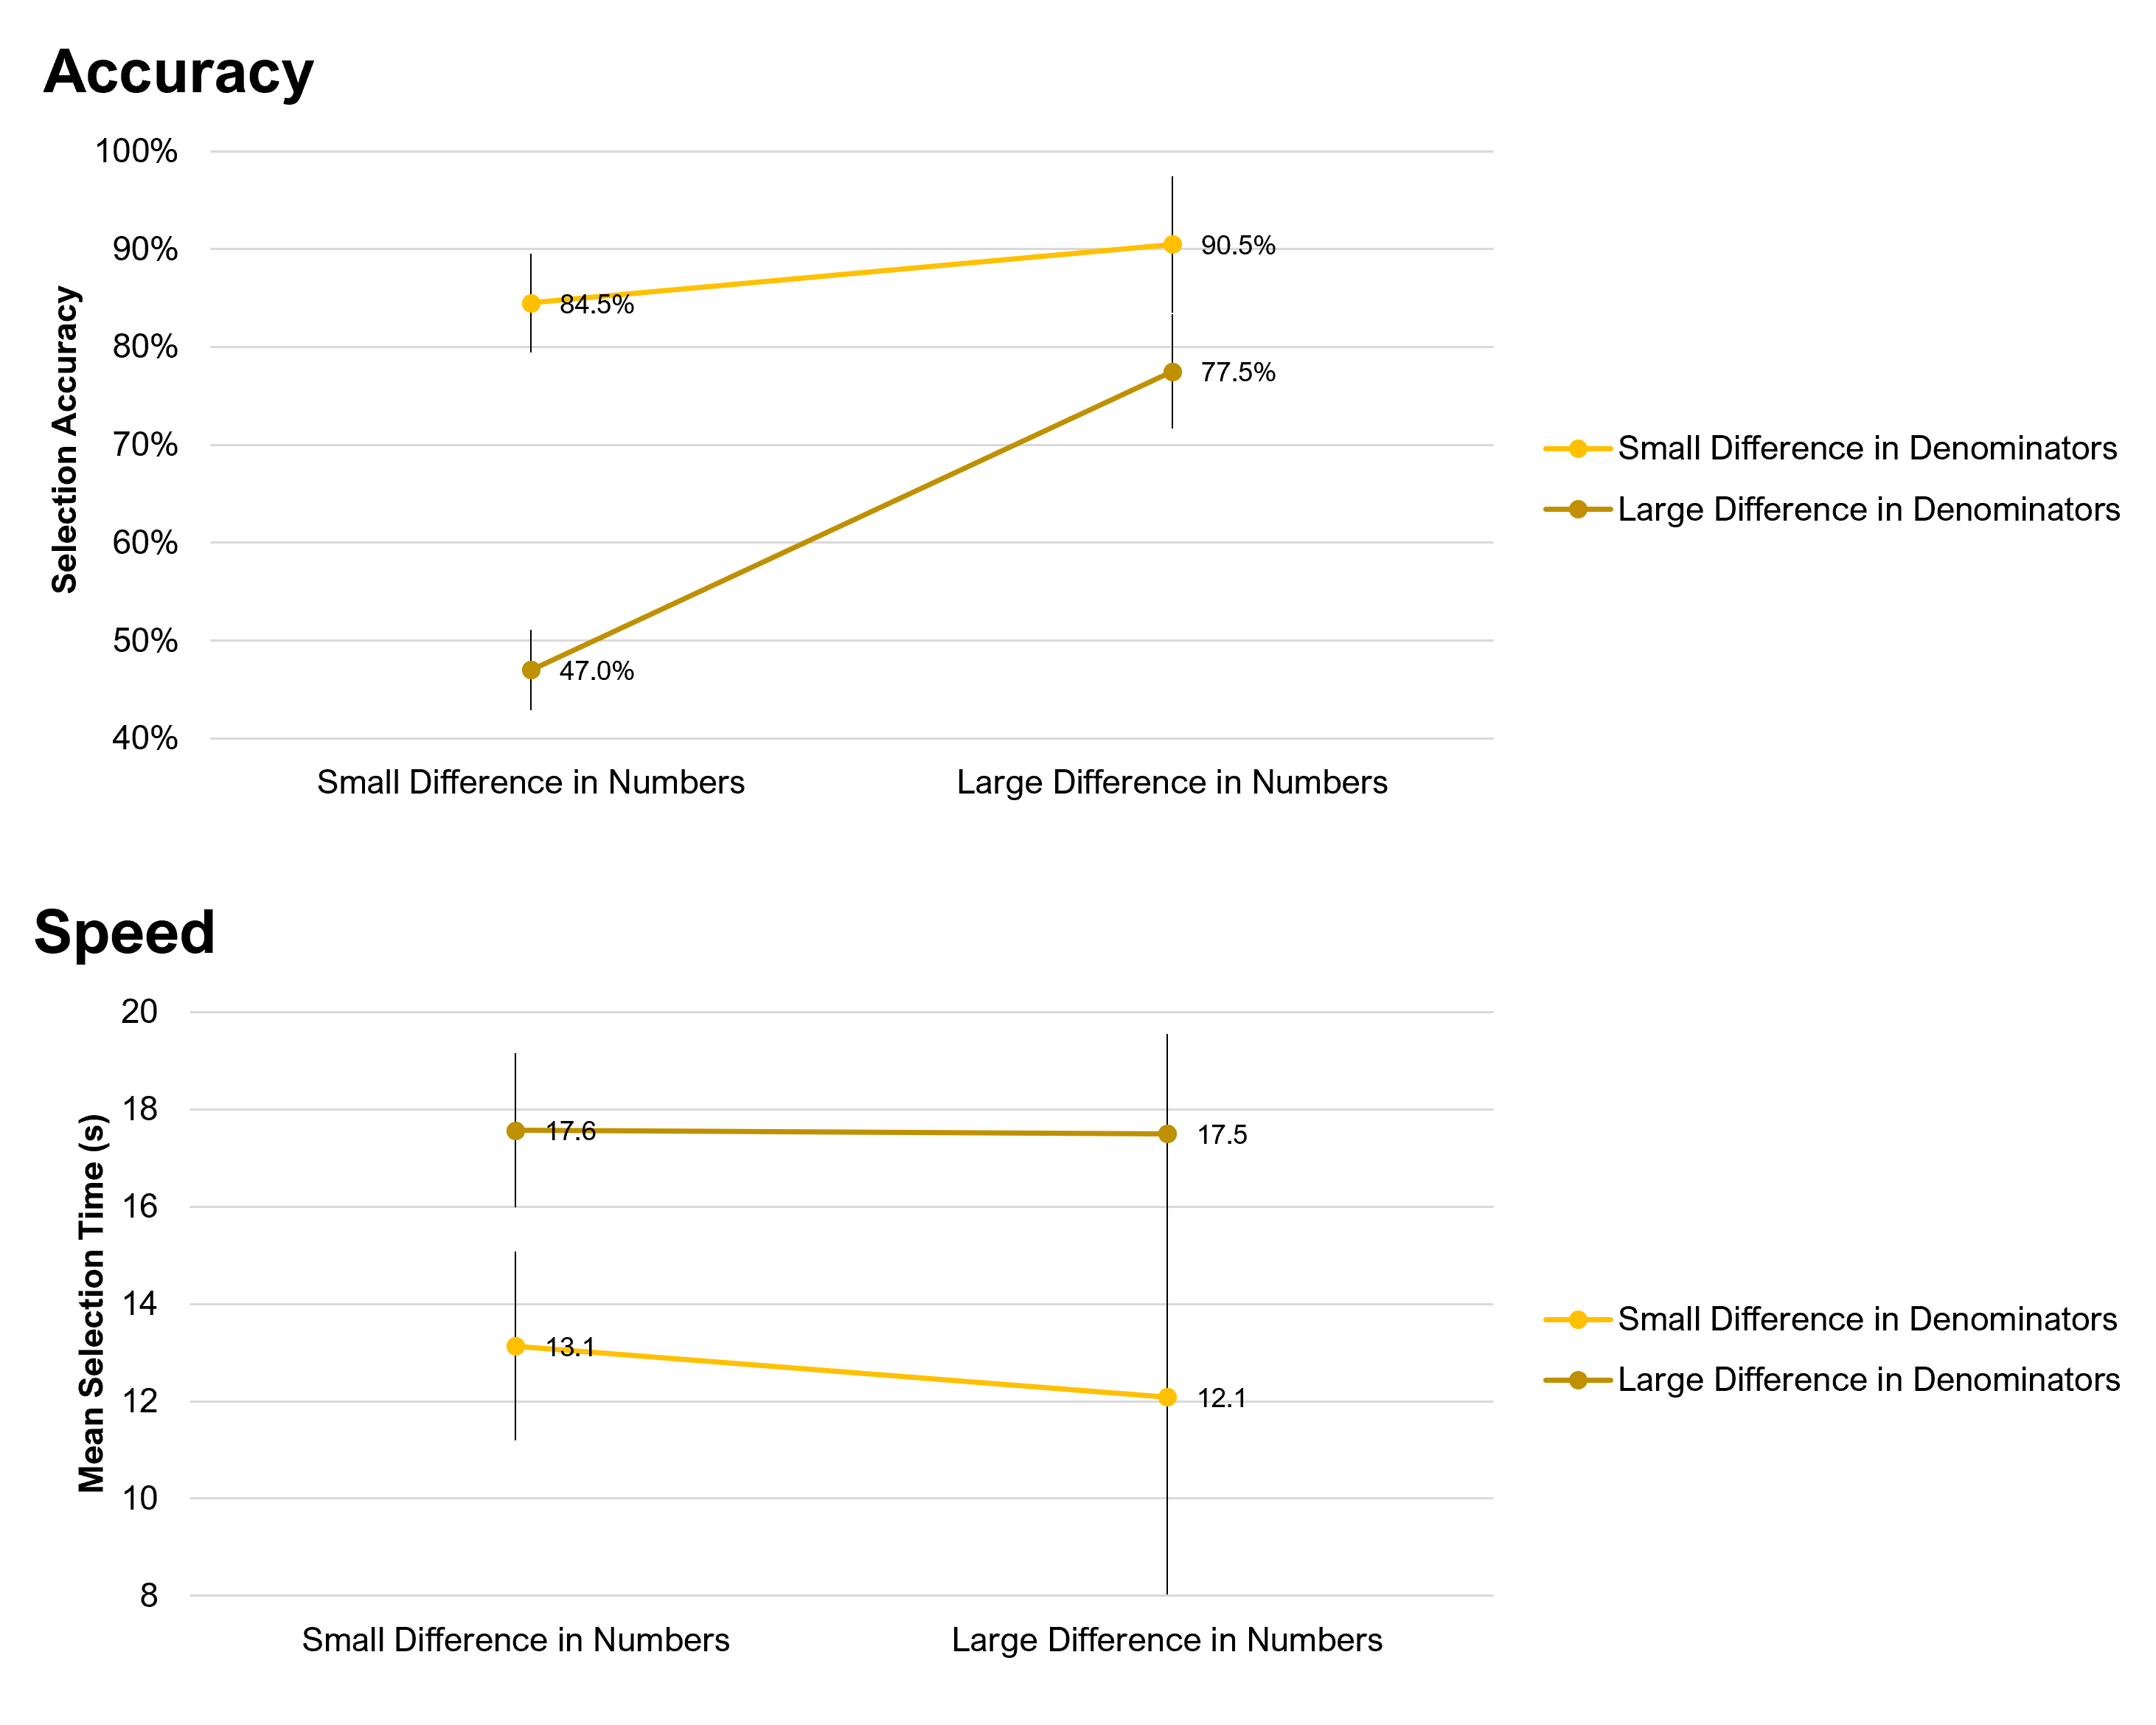
Figure 3: Results of mini-experiment on fractions with different denominators.
For accuracy, both main effects and their interaction were significant (Difference in Numbers: F(1, 199) = 50.8, p < .0001, partial η2 = .20; Difference in Denominators: F(1, 199) = 74.6, p < .0001, partial η2 = .27; Interaction: F(1, 199) = 33.7, p < .0001, partial η2 = .15). For speed, only the main effect of Difference in Denominators was significant (F(1, 199) = 13.9, p < .0001, partial η2 = .07).
To make sense of these results, it’s necessary to examine the fractions being compared. Here are the four specific problems and potential paths to their solutions illustrating the difference in their difficulties.
- 6/9 vs. 2/10 (Accuracy: 90.5%, Selection Time: 12.1 s): 6/9 is two thirds, about 67%; 2/10 is 20%—so 6/9 is larger.
- 6/12 vs. 5/11 (Accuracy: 84.5%, Selection Time: 13.1 s): 6/12 is 50%; 5/11 is close to 50% and would be if the denominator was 10, but because the denominator is 11 it must be a little less than 50%—so 6/12 is larger.
- 3/8 vs. 7/13 (Accuracy: 77.5%, Selection Time: 17.5 s): 3/8 is less than half; 7/13 is a little more than half—so 7/13 is larger.
- 2/7 vs. 5/17 (Accuracy: 47.0%, Selection Time: 17.6 s): 2/7 is between a quarter and a third; 5/17 is also between a quarter and a third. I would like to finish this survey and get on with my life, so I’ll just pick one (a plausible reason why the accuracy is close to 50%).
The main takeaway from this additional analysis is not only was it generally more difficult to compare fractions with different denominators, but also, the more different the denominators were, the more difficult it was to compare them. Across a wider range of fractions than those used in this experiment, the difficulty of comparison might also be influenced by how easy it is to mentally compute the percentage for a fraction (e.g., 2/100 vs. 4/8 is easier than 2/7 vs. 5/17).
Preference Results
After making the 16 judgments, participants indicated which format (if either) they thought was easier to compare (Figure 4). Almost all participants (85%, 170/200) preferred comparing percentages, and only one (0.5%) preferred comparing fractions.
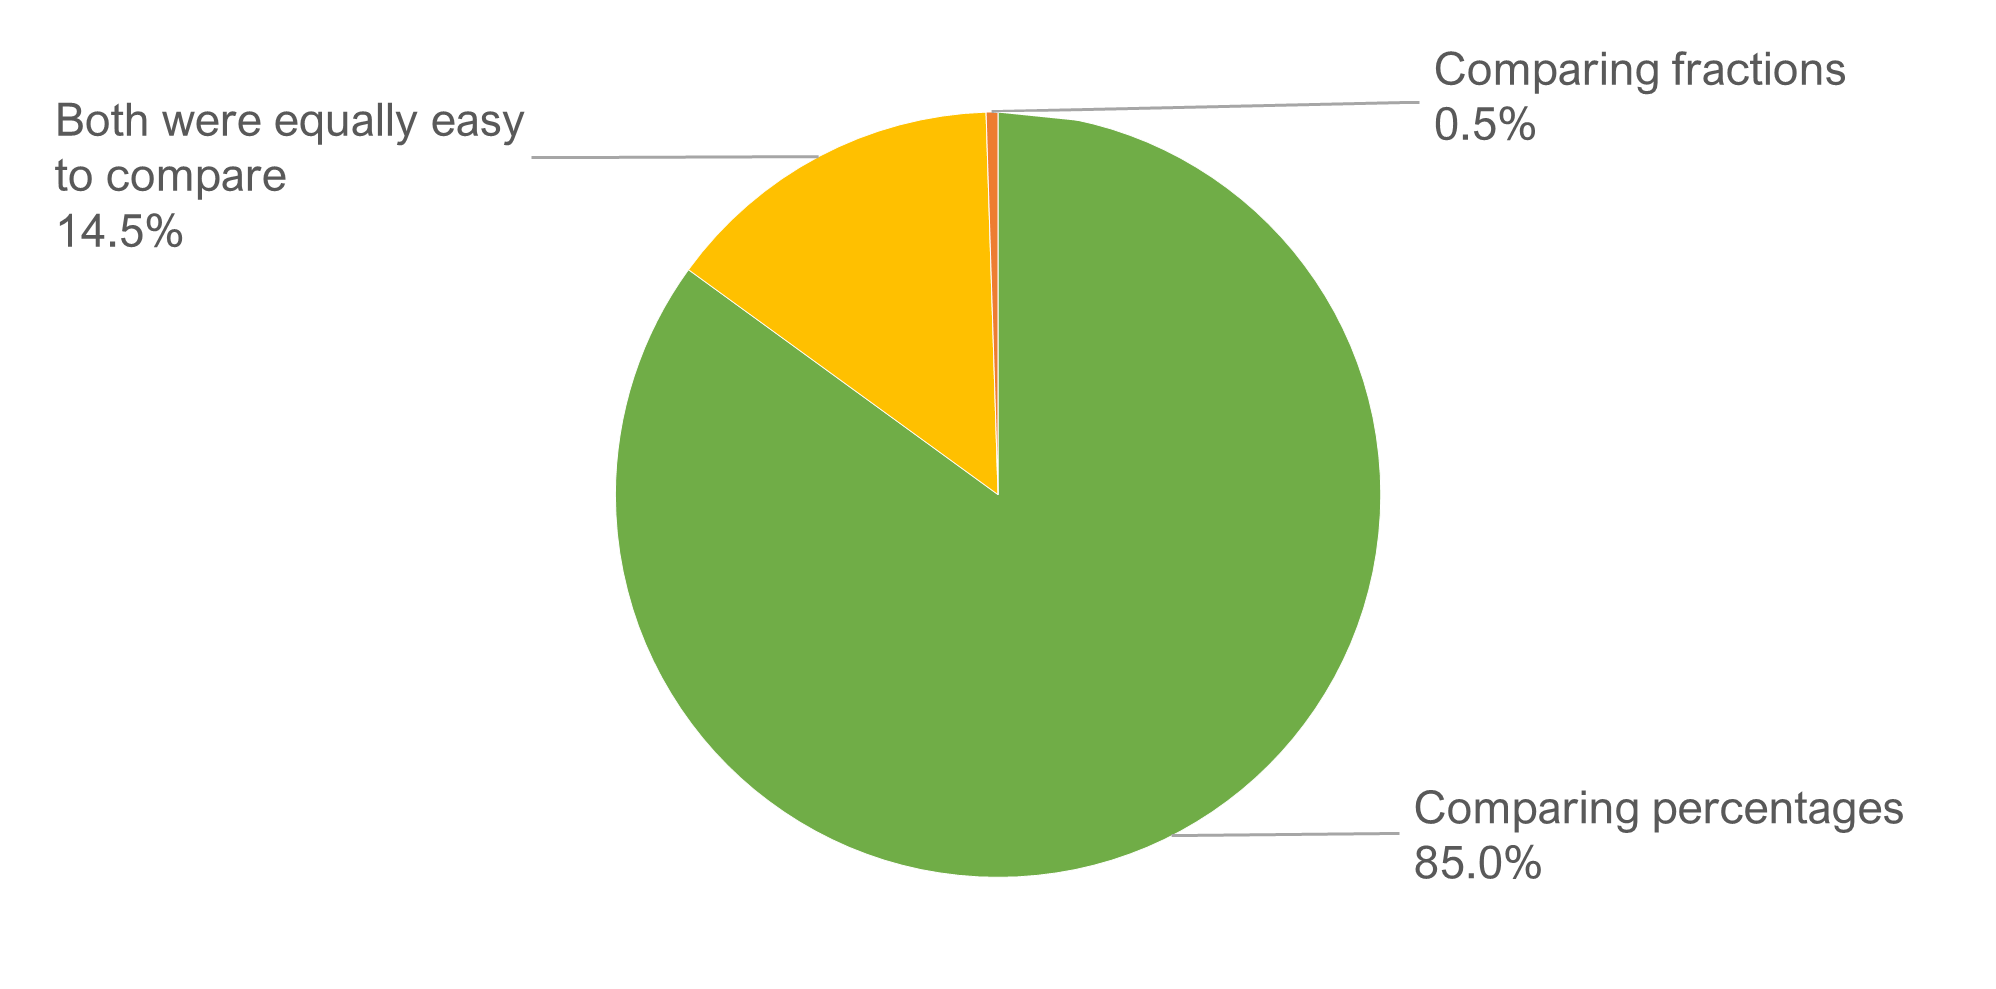
Figure 4: Preference results (which was easier to compare).
Discussion
In some ways, these results were not surprising. After recalling our experiences in fourth-grade math, we expected differences in percentages to be easier to judge than fractions when the denominators were different, especially when differences were small and denominators very different.
For example, the problem shown in Figure 1 Example D had participants deciding whether 2/7 was greater or less than 5/17. This is difficult to do without a calculator because the difference is less than 1% (2/7 = 28.6%, 5/17 = 29.4%). Consequently, this comparison had the lowest accuracy (47%, roughly a coin toss).
When the denominators are the same, all people need to do is compare the numerators, so we were somewhat surprised that accuracy with percentages was significantly better than with fractions that had the same denominator.
Regarding the cognitive activities involved in interpreting fractions, Gabriel et al. (2013) noted, “current evidence about how fractions are represented in the human brain is controversial.” In fact, it’s likely that three out of every two people may struggle with fractions.
Given these objective findings, it’s not surprising that almost all participants thought it was easier to compare percentages.
So, what does this mean for UX practitioners?
The information in the fractions is valuable to readers because the denominator shows whether the corresponding percentage was based on a small, medium, or large sample size. Also, presenting both the numerator and denominator provides the information needed to compute percentages and a confidence interval around the percentage. Unless this information appears elsewhere in your report, we recommend presenting fractions.
However, if you want it to be as easy as possible for people consuming your research to make accurate and rapid comparisons of data that can be presented as fractions or percentages, your first choice should be percentages.
We encourage you to report percentages. Your readers will like them, and if you get pushback from someone, maybe this will help.
You can include percentages …
in a report that people will read while they cavort,
or in a paper while they caper,
or in an appendix while doing ten tricks,
and, best of all …
even when samples are small.
Summary
Should you report percentages from small sample studies?… Yes, you should. Our experiment of 200 participants comparing the magnitudes of two fractions or two percentages strongly supports the practice of reporting percentages even when sample sizes are small.
Percentages are easier to compare than fractions. The accuracy of comparing percentages was near perfect (significantly better than comparison of fractions). Selection speeds for percentages were consistently faster than those for their respective fractions.
Fractions are difficult to compare when denominators are not the same. Not only was it generally more difficult to compare fractions with different denominators, but the more different the denominators were, the more difficult it was to compare them. In the most extreme case, the selection accuracy was roughly a coin toss (47%).
Fractions are easier to compare when denominators are equal. When denominators are equal, the accuracy of comparing fractions is high (> 90%—but not as high as the accuracy with percentages).
Most people report finding it easier to compare percentages than fractions. When asked whether it was easier to compare percentages or fractions (or equally easy), 85% of participants selected percentages, 0.5% selected fractions, and 14.5% indicated they were equally easy.
Limits to generalization: You can’t manipulate all possible variables in a single experiment. In this experiment, participants always selected which value was larger. We doubt that participant performance or attitude would be affected by instead selecting which value was smaller, or if we varied the selection of larger and smaller values, but we always have to keep in mind Abelson’s 7th law, “You can’t see the dust if you don’t move the couch” (i.e., you don’t know for sure what the effect of a context variable will be until you vary it). Also, these comparisons were more controlled in their presentation than might be typical in a research report.


