 “Don’t include numbers when reporting the results of small-sample research studies!”
“If you must, definitely don’t use percentages!”
“And of course, don’t even think about using statistics!”
We regularly hear variations of this advice from well-intentioned researchers, often senior ones. In 2005, we encountered this debate among UX professionals when we participated in a workshop focused on effective report formats for formative usability studies (for the workshop report, see Theofanos et al., 2005). We didn’t agree with the recommendation then, and we don’t agree with it now.
Why Researchers Might Avoid Numbers in Small-Sample Studies
We have some ideas why researchers would avoid using numbers in small-sample studies and even fervently discourage others from using them.
Avoid competition. They may have found that their research is better received in their org if they don’t compete with other departments (e.g., Data Science or Market Research) who “own” the numbers or method (and often have a background in large-sample statistical analysis but not necessarily any expertise in small-sample analysis/interpretation). There may be unwritten rules like, “UX doesn’t do A/B tests” or “Market Research doesn’t test the product.”
Avoid statistical significance. We get it. When your current connections to statistical significance are flashbacks to a required statistics course that used only large samples and examples far removed from UX research, it can seem like statistical considerations are unrealistic and unnecessary.
Dodge the sample size quagmire. Yeah, it can be a buzzkill. Statistical significance is hard enough, but sample size calculations require working backward to estimate the needed sample size. Having that discussion isn’t easy. It involves multiple parameters and assumptions. Fortunately, we have developed several tables that can inform problem-discovery studies and other small-sample research. For example:
- How to Find the Sample Size for 8 Common Research Designs
- Sample Sizes for a SUS Score (Confidence Interval)
- Sample Sizes for Comparing SUS to a Benchmark
- Sample Sizes for Comparing SUS Scores
The correct way is hard to explain. It’s not easy to understand, much less succinctly explain, statistical concepts and their applications to UX research (e.g., problem discovery versus population parameter precision). No one wants their expertise (and career) challenged by having to defend difficult and nuanced concepts.
What We Recommend
Use numbers. Providing raw numbers allows you to estimate the prevalence of an issue, which is often (though not always) the best way to prioritize. Knowing that one out of ten people experienced an issue in one prototype versus eight out of ten in an alternative prototype provides a lot of information about the prevalence of issues.
Don’t rely exclusively on the frequency of occurrence for problem prioritization. For decades, it’s been recognized that the prioritization of usability problems needs to account for two key metrics—frequency of occurrence and impact on users (Lewis et al., 1990). Of these two, fixing high-impact problems is often more important than fixing high-frequency (but low-impact) problems. Other prioritization metrics include the likelihood of encountering the problem in use (i.e., did the problem occur in a frequently or infrequently used part of the product) and ease/cost of implementation. In prioritization, numbers matter, but they’re not the only thing that matters.
Use confidence intervals. Often the raw percentage or number is enough to understand the prevalence of an issue. But using a confidence interval shows you upper and lower bounds that establish a range of plausibility (Smithson, 2003). The thing about small-sample research studies is that if you see something, it’s usually a common rather than uncommon issue. It can be counterintuitive (like the Monty Hall problem), but it’s true. Essentially, because you are using a small sample size, you are much more likely to see common issues because if they weren’t common, you probably wouldn’t have observed them.
Yes, you can use statistics on small sample sizes. There’s a common misconception that small samples are unyielding to statistical analysis. But just because it’s harder to prove statistically significant differences with small sample sizes (due to lower power) doesn’t mean you can’t use stats and demonstrate statistically significant results. For example, if 1 out of 10 users encounter a problem, is that problem statistically less common in the user population than one that affects 8 out of 10? In this case, you don’t need to conduct a significance test—just compute the adjusted-Wald binomial confidence intervals for each fraction. As shown in Figure 1, the highest plausible value for 1/10 with 95% confidence is 43%, and the lowest plausible value for 8/10 is 48%. The confidence intervals don’t overlap, so even with all the uncertainty due to small sample sizes (which makes the confidence intervals very large), problems that were seen 8/10 times are significantly more likely to occur than those that were seen 1/10 times.

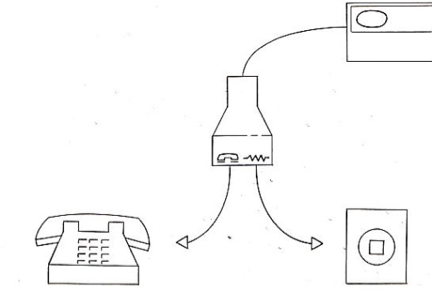
With a small sample, you can statistically prove that something is broken, but it takes a large sample to prove that something works well. One of the most useful analyses you can do with a percentage is to check whether the lower boundary of a confidence interval around a defect rate is unacceptably high. For example, consider the device illustrated in Figure 2.

The purpose of this device (RJ-11 splitter) was to allow the connection of a landline telephone to a computer; the phone symbol indicated where to plug the RJ-11 cable into a phone, and the zigzag line indicated where to plug the RJ-11 cable into the wall outlet.
Lewis and Pallo (1991) conducted a usability study with 11 computer-naïve participants to see if they would successfully connect a phone to a computer if the only information participants had to guide the connection were the symbols on the splitter device. Nine of eleven participants incorrectly connected the RJ-11 cable. The 95% confidence interval for 9/11 (82%) failures ranges from 51% to 96%. Because the lowest plausible failure rate was over 50%, the risk of incorrect connections was unacceptably high.
In a second usability study, 10/10 computer-naïve participants correctly connected the RJ-11 cables using the wordless instruction graphic in Figure 3. The 95% confidence interval around the observed failure rate of 0/10 ranges from 0 to 25%. Even though this was a clear improvement relative to the first study, it doesn’t prove that the graphic instruction would lead to a very high rate of successful installations because it is still plausible that the failure rate could be as high as 25%.
The first study definitively proved that the icons alone were not enough to guide correct installation. The second study demonstrated improvement, but it did not definitively prove a low failure rate. To get the upper limit of the failure rate down to 5%, you’d have to run a study in which there were zero failures in a sample size of 62. If there was just one failure, the sample size would have to be 121 to get an upper limit of 5%. Although landline phones are fading away, the principles applied when analyzing this type of data are timeless.
You don’t have to report statistics. Just because you can report confidence intervals and p-values, don’t feel like you always must. The content of a report depends on the expected audience. On the other hand, even though you might not report them, when they’re potentially applicable, you should have them available, either in an appendix or in your notes. That way, when you argue that they aren’t important in the qualitative work you’ve done, the fact that you’ve done the analyses shows that you base your argument on a deep understanding of your research rather than not knowing how to do and apply the analyses.
You can use percentages with any sample size. There is a perception that you must have a large sample size (above 30 or 100) to use percent. However, percent simply means “per 100.” You can compute a proportion or percentage on any sample size. Of course, very small samples mean the point percentage, while a decent guess of the total population’s percentage, is almost surely wrong. Compute a confidence interval around a percentage to provide a plausible range of the unknown population proportion.
Percentages can be distracting. With small sample sizes, especially with less common numbers, some stakeholders find it distracting to look at percentages. This can be exacerbated with decimal points (unnecessary and unwarranted precision). For example, Table 1 shows the percentages you can get with a sample size of seven people (compare the clarity of having no digits after the decimal point with having two). We suspect many stakeholders interpret problem statements using heuristics for the quantities (none, very few/some, half, most, almost all, all) and will do some quick calculations when they see 3/7 (43%, about half) or 6/7 (86%, almost all). While not always the case, this heuristic is usually not harmful.
| Number | Total | Percentage (no digits after decimal point) | Percentage (two digits after decimal point) |
|---|---|---|---|
| 0 | 7 | 0% | 0.00% |
| 1 | 7 | 14% | 14.29% |
| 2 | 7 | 29% | 28.57% |
| 3 | 7 | 43% | 42.86% |
| 4 | 7 | 57% | 57.14% |
| 5 | 7 | 71% | 71.43% |
| 6 | 7 | 86% | 85.71% |
| 7 | 7 | 100% | 100.00% |
Percentages are easier to compare when denominators are different. When the denominators are the same, then larger numbers of events are clearly more frequent than smaller numbers of events. But in UX research, the denominators are not always the same. Suppose 11 experts and 17 novices were in a usability study. Which is larger—6/11 or 9/17? If converted to percentages, the comparison would be between 54.5% (6/11) and 52.9% (9/17). If you can do that calculation in your head, congratulations! But it might be easier on your readers to present percentages either alone or, even better, with the numeric ratios so the sample size is evident.
Don’t confuse formative and summative research. The goals of formative and summative research are different, and those differences are reflected in the measurement and statistical practices appropriate for each. In general, formative research is focused on discovery (e.g., discovery of problems in usability studies or themes in interviews), so the statistical models applied to the sample sizes needed to achieve saturation (discovery of a targeted percentage of whatever you’re trying to discover) are different from the more widely known statistical methods for estimation (confidence intervals) or comparison. For example, when you hear someone say you need only five users to find 85% of problems in a usability study (formative research), be aware that statement is true only when a particular set of assumptions has been met. You can conduct both formative and summative research with small or large sample sizes—you just have to know which statistical techniques to use and when they are appropriate.
Discussion
As a UX researcher, you might have been exposed to the idea that you shouldn’t report numbers or percentages when sample sizes are small. We hope this article has demonstrated that there are counterarguments to that assertion.
Many people with formal training in statistical analysis have been exposed only to techniques that require large samples, but a wide range of statistical methods work fine with small samples. A study with low power doesn’t mean it has no power—it just means that it’s limited to the probable discovery of frequently occurring events (formative research), less precise confidence intervals, and statistical significance only for large effect sizes (summative research). We have spent much of our careers combing the statistical literature and conducting our own research to find methods that will work with small samples, with a focus on application to UX research.
For more information:
- Jump in a time machine and check out the IBM Technical Report, “Legitimate Use of Small Samples in Usability Studies: Three Examples.” It was written by Jim Lewis in 1991, having at that time spent ten years at IBM struggling with some of these conceptual issues.
- For a more modern and comprehensive survey of these topics, see the 2nd edition of our book, Quantifying the User Experience (Sauro & Lewis, 2016). It’s a statistics book for UX researchers that describes many small-sample methods that do not appear in standard university statistics courses or textbooks.
- If you prefer audiovisual learning, we offer several courses at MeasuringUniversity, including Practical Statistics for UX and Customer Research, which has much of its content based on Quantifying the User Experience.