 Near the top of the list of concerns people have when using statistics with UX data is what to do with non-normal data.
If you remember only a few things from statistics class, you might recall something about data needing to look like the infamous bell curve; more specifically, it needs to be normally distributed. That is, your data should look something like the roughly symmetrical bell-shaped distribution of men’s heights shown in Figure 1.
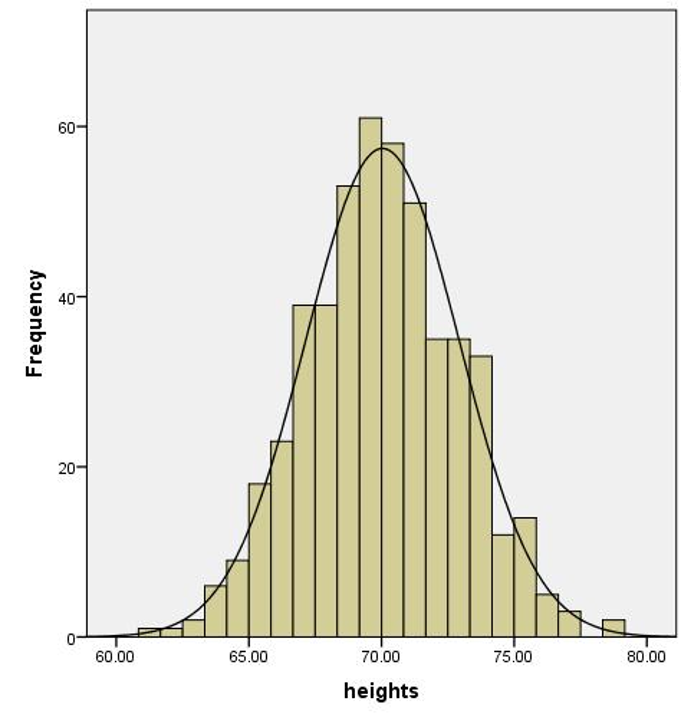
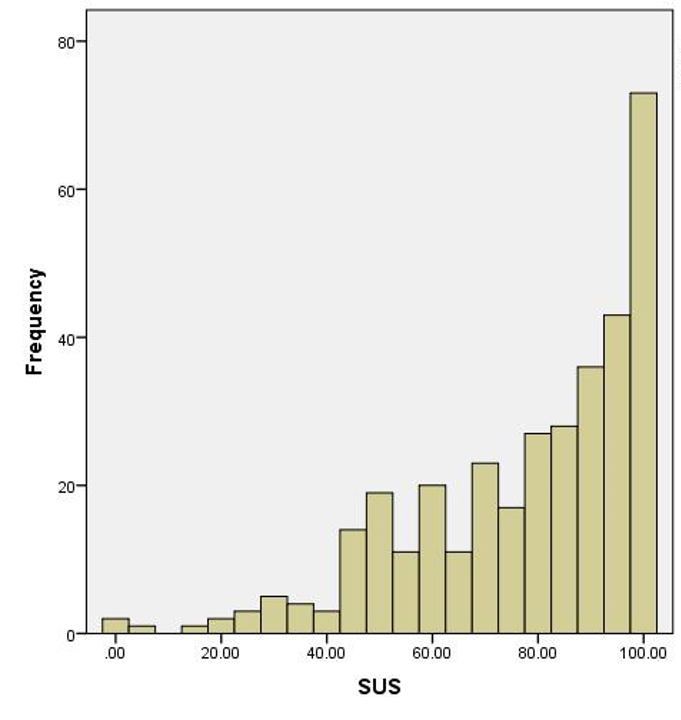
Figure 2 shows a graph of System Usability Scale (SUS) data from 343 participants finding information on an automotive website. It hardly looks anything like Figure 1.
In a previous article, we covered why data that’s not normally distributed can still be used in statistical tests that have an assumption of normality. Thanks to the Central Limit Theorem, the sampling distribution of means tends to be normal even when the underlying data isn’t normal, especially when the sample size is large (above 30).
But the Central Limit Theorem isn’t a cure-all. There are still cases where some types of distributions (e.g., Bradley’s L-shaped distribution of reaction times) require very large samples before the distribution of means becomes normal.
What Is a Parametric Method?
Some of the most common statistical tests are called parametric methods (or parametric tests when making comparisons). The word parametric (not to be confused with first responders) comes from parameter. A parameter is a characteristic of a population, such as the mean, standard deviation, proportion, or median.
The mean height of all adult men in the U.S. would be a parameter. The data of the 500 U.S. men in Figure 1 represent a sample with a mean (a sample statistic) that we use to estimate the population mean (the parameter).
Somewhat confusingly, a parametric method assumes that the sample data follow a distribution, usually a normal distribution. The parameter of interest is usually, but not always, the mean. When the population data roughly follow a normal pattern, we can make statements about the unknown population mean from the sample data with a fair amount of accuracy.
The t-test and analysis of variance (ANOVA) are two examples of famous and widely used parametric tests. They both use the sample mean and sample standard deviation to make inferences about whether there is a difference between unknown population means.
What Is a Nonparametric Method?
Why, it’s the opposite of a parametric method, of course! Also, it turns out rather confusingly that there isn’t a good, widely accepted definition of what constitutes a nonparametric method. The quote below from the Handbook of Nonparametric Statistics (Walsh, 1962, p. 2) is 60 years old, but not much has changed: “A precise and universally acceptable definition of the term ‘nonparametric’ is not presently available.”
Another term, which may be a better description, is a distribution-free method. As the name implies, we are NOT making any assumptions about how the population distributes when using a distribution-free/nonparametric method. That is, the methods don’t assume (so we don’t care) if the population or the distribution of its means is normal.
In Distribution-Free Statistical Tests, Bradley (1968, p.15) wrote,
“The terms nonparametric and distribution-free are not synonymous, and neither term provides an entirely satisfactory description of the class of statistics to which they are intended to refer. Popular usage, however, has equated the terms and they will be used interchangeably throughout this book.”
He defined a nonparametric test as one that makes no hypothesis about the value of a parameter in a statistical density function. A distribution-free test, on the other hand, makes no assumptions about the sampled population. Confusingly, in this classification scheme, a test can be both distribution-free and parametric. (For example, the binomial sign test doesn’t assume any exact shape for the sampled population but tests the hypothesis that the parameter p of a binomial distribution is 0.5). Following Bradley’s observation, we also use the terms interchangeably.
Why not just always drop the assumption of normality and use nonparametric methods, you may ask? Well, it turns out the price to pay in dropping assumptions is often (but not always) a loss of precision, a loss of statistical “power.” It typically takes a larger sample size to detect differences with nonparametric methods. For example, a common strategy for nonparametric tests is to convert raw data into ranks and then compute statistics and significance levels from the resulting ranks. Converting to ranks loses some information and hence some of the statistical power.
What Should You Use?
Which gets us to the main question of this article: what should you use? Unfortunately, it depends on who you ask. There are theoretical and pragmatic reasons to select either parametric or nonparametric methods, with different camps of statisticians defending their positions.
To add to the confusion, the distinction of whether a method is parametric or nonparametric is itself a bit fuzzy. For example, when comparing two independent proportions we recommend using a modified Chi-Square test called the n−1 Two Proportion Test. The Chi-Square test is based on the Chi-Square distribution, which can be approximated by the normal distribution. It clearly sounds like a parametric test because we are talking about population distributions, right? Wrong. It’s most often (though not always) classified as a nonparametric method.
Blurry taxonomies are not unique to statistics. Classification can be messy. But we consider ourselves pragmatic and don’t feel the need to adhere to rigid classification schemes. Instead, we pick the test that gets us the best results over the long run with actual (not just simulated) UX data. We also consider the constraints of sample sizes and the typical context where we know the consequences of being “wrong” don’t typically result in catastrophes.
In Quantifying the User Experience, we present the key analyses that UX researchers need. We provide the recommended method, its justification, and how to compute it by hand, using our Excel calculator or in R. Table 1 shows these key procedures, the corresponding parametric, associated nonparametric method, and the chapter in which we discuss it.
| Procedure | Parametric Method | Nonparametric/Distribution-Free Method | Chapter |
| Confidence Interval for a Mean | t-confidence interval | confidence interval around median for completion times | 3 |
| Confidence Interval for a Proportion | na | adjusted-Wald binomial interval | 3 |
| Comparing a Mean to Benchmark | 1-sample t-test | Wilcoxon signed-rank test | 4 |
| Comparing Proportion to Benchmark | na | binomial test (mid-p) | 4 |
| Comparing Two Independent Proportions | na | n-1 two-proportion test | 5 |
| Comparing Two Dependent Proportions | na | McNemar test (mid-p) | 5 |
| Comparing Two Independent Means | 2-sample t-test | Mann–Whitney U test | 5 |
| Comparing Two Dependent Means | paired t-test | Wilcoxon signed-rank test | 5 |
| Comparing 2+ Independent means | ANOVA (one way) | Kruskal–Wallis test | 10 |
| Comparing 2+ Dependent Means | ANOVA (repeated measures) | Friedman test | na |
| Correlation between Variables | Pearson correlation | Spearman rank correlation; | 10 |
| Phi correlation (binary data) |
Table 1: Parametric and nonparametric/distribution-free methods for the analysis of key types of UX data (recommended methods are highlighted).
For example, to compare two independent means, the parametric procedure is the 2-sample t-test and the nonparametric method is the Mann–Whitney U test. We recommend the 2-sample t-test because it’s robust against violations of normality and provides better power.
Summary and Discussion
UX researchers are rightly concerned about whether they should use parametric or nonparametric methods to analyze their data. Researchers have a responsibility to conduct proper analyses. The answer to the question we posed in the title of this article, however, requires some nuance.
A parametric statistical method assumes that the population from which a sample was taken, or the statistic computed from the sample, follows a known distribution, usually a normal distribution. It is often justified by reference to the Central Limit Theorem.
The definition of nonparametric is fuzzy. There isn’t a good definition of a nonparametric method, and the distinction between the two is fuzzy. Adding to the fuzziness is the potential distinction between nonparametric and distribution-free methods. Both differ from parametric methods in different ways.
Choose the method with more power (usually). Some continuous data can be analyzed using either parametric or nonparametric/distribution-free methods, as shown in Table 1. In such cases, we prefer the parametric methods, as they are usually more powerful and precise.
For example, in 1993, Jim Lewis published data showing it was better to analyze means of multipoint rating scales than to analyze their medians, and that the outcomes (observed significance levels) of 2-sample t-tests and Mann-Whitney U-tests were almost identical.
UX researchers should use both parametric and nonparametric/distribution-free methods in accordance with which is best for the type of data being analyzed, much like you should use a hammer to drive nails and a lathe to shape wood. Table 1 in this article and our book, Quantifying the User Experience, provide guidance about which method is best to use with which data.
Completion time data is an exception. One exception to this is the computation of confidence intervals for completion time data, which is often skewed, so when n > 25, we recommend the nonparametric method of constructing a confidence interval around the median.
Binary data is usually nonparametric. Because analysis of binary-discrete data (percentages or proportions) does not assume normality, these methods are usually classified as nonparametric, and there are no widely accepted parametric alternatives.
There is some interesting research showing interpretable results when using discrete-binary or rank data in ANOVA, but we generally prefer using nonparametric methods to analyze discrete-binary data.
Stay tuned for future comparisons. In future articles, we plan to compare the outcomes of parametric and nonparametric methods when both can be applied to a set of data (e.g., paired t-tests vs. Wilcoxon signed-rank test, ANOVA vs. Friedman and Kruskal–Wallis tests, Pearson vs. Spearman correlations). We will focus on the types of data commonly collected in UX research.


