 Say you collect rating scale data from dozens of users across ten apps. To analyze the data, you compute medians because you learned that rating scale data isn’t interval or ratio data.
The medians of all ten apps end up the same. They’re all 4!
If you rely on the medians, you’d conclude the apps are essentially equivalent.
But if you compute the means, the ratings range from 3.6 to 4.6, providing a much clearer differentiation.
How can the same dataset produce such different stories? What’s the “right” way?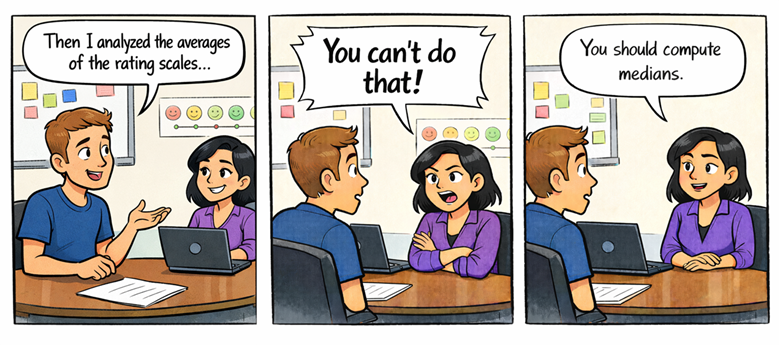
Why are some researchers so adamant about NOT computing the means of rating scales like the Single Ease Question (Figure 1)? In this article, we explain why taking the median of rating scale data is a poor practice.
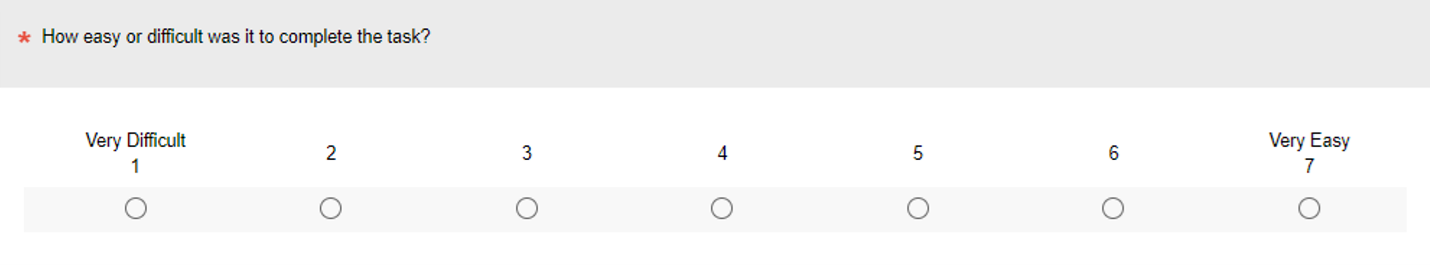
Figure 1: The Single Ease Question (SEQ®).
Stevens in 1946 Said Ordinal Data Can’t Be Averaged
Ever since S. S. Stevens declared in 1946 that numbers are not all created equal by categorizing them as ratio, interval, ordinal, and nominal, analysts have debated whether it’s legitimate to compute the mean of multipoint rating scales such as the SEQ. Based on his “principle of invariance,” he argued against doing anything more than counting nominal and ordinal data, which restricts addition, subtraction, multiplication, and division to interval and ratio data. These are exactly the operations needed to compute the mean of a set of data: “Thus, the mean is appropriate to an interval scale and also to a ratio scale (but not, of course, to an ordinal or a nominal scale” (Stevens, 1959, p. 28).
But Lord in 1953 Says Numbers Don’t Know They Are Ordinal
It didn’t take long for other statisticians and measurement theorists to craft arguments against the proposed policy of restricting analysis of ordinal and nominal data to counts and medians. Probably the most famous counterargument was by Lord (1953). And we’re not referring to the “Royals” singer nor a deity, but a late psychologist with a divine name and lasting contributions (including the SAT and GRE tests).
In his parable of a retired professor, Lord described a machine used to randomly assign football numbers to the jerseys of freshmen and sophomore football players at his university … a clear use of numbers as labels (nominal data). After receiving their numbers, the freshmen complained that the assignment wasn’t random. They claimed to have received generally smaller numbers than the sophomores and that the sophomores must have tampered with the machine.
The professor consulted with a statistician to investigate how likely it was that the freshmen got their low numbers by chance. Over the professor’s objections, the statistician determined the population mean and standard deviation of the football numbers as 54.3 and 16.0, respectively. He found that the mean of the freshmen’s numbers was too low to have happened by chance, strongly indicating that the sophomores had tampered with the football number machine to get larger numbers. The professor objected to the analysis because the numbers weren’t even ordinal, but the statistician replied, “The numbers don’t know that; since the numbers don’t remember where they came from, they always behave just the same way, regardless.”
Even Nonparametric Tests Quietly Compute Means
For analyzing ordinal data, some researchers have recommended using statistical methods that are similar to the well-known t– and F-tests, but which replace the original data with ranks before analysis. These are the so-called nonparametric methods (e.g., the Mann–Whitney U test, the Friedman test, or the Kruskal–Wallis test). But here’s the dirty secret: These methods actually compute the means of the ranks (or an equivalent process), which are ordinal (not interval or ratio) data! Despite these violations of permissible data manipulations from Stevens’ point of view, those methods work perfectly well.
Why Medians Are Poor Estimates of Central Tendency for Rating Scales
When is computing a median a good practice, and why doesn’t it work well with rating scales?
When to Compute a Median
The mean and median are both common ways to measure the central tendency of a set of data. To calculate the mean, add up the data points and divide by the total number in the group (the sample size, n). With the mean, every data point contributes to the estimate. The median is simply the center point of a distribution (or, if there is an even number of points, the average of the two center points).
The mean usually works well as a measure of central tendency, especially when the distribution is roughly symmetrical. When the data aren’t symmetrical, however, the mean can be sufficiently influenced by a few extreme data points (e.g., time data, currency values), so it’s no longer a good estimate of central tendency. When that happens, the median can be a better estimate of central tendency than the mean.
But Rating Scales Are Bounded and Discrete
The examples of data types that can be better summarized with the median than the mean have two things in common:
- An unlimited range with a small number of extreme scores
- Continuous measurement
Rating scales, however, have a limited range and fundamentally discrete measurements. Because the ratings are discrete, the median can take only one of a restricted number of values regardless of the sample size. For a five-point scale, the median can take only the following values, no matter how large the sample: 1.0, 1.5, 2.0, 2.5, 3.0, 3.5, 4.0, 4.5, and 5.0. (And it can take the intermediate values only when n is even.)
The mean, on the other hand, can take any value between 1 and 5, and as the sample size increases, the mean becomes more and more continuous. Because the mean can be a larger number of values, it can reflect differences between two samples more reliably than the median difference.
When scales are open-ended (have at least one endpoint at infinity, like time data), extreme values can affect the mean but will not affect medians. Rating scales, however, are not open-ended, so the median does not have a compelling advantage over the mean when analyzing individual rating scales. Instead, it is at a distinct disadvantage.
Eleven Mobile Apps That Look the Same Using Medians (A Real Example)
So, we weren’t making up the story about a bunch of apps having the same median (we just changed the number from eleven to ten). The story comes from our data.
In our 2026 UX benchmark of clothing websites, we asked respondents who used the mobile apps of various companies to rate their usefulness with a five-point scale. Table 1 shows the means, medians, and sample sizes for the companies included in the benchmark.
| Mobile App | Mean | Median | n |
|---|---|---|---|
| Anthropologie | 3.94 | 4.00 | 18 |
| Athleta | 4.26 | 4.00 | 23 |
| Banana Republic | 4.42 | 4.00 | 19 |
| Gap | 4.44 | 4.00 | 18 |
| H&M | 4.64 | 5.00 | 11 |
| Lululemon | 3.57 | 4.00 | 23 |
| Neiman Marcus | 4.21 | 4.00 | 24 |
| Nordstrom | 4.12 | 4.00 | 17 |
| Old Navy | 4.00 | 4.00 | 13 |
| Urban Outfitters | 3.91 | 4.00 | 22 |
| Zara | 4.30 | 4.00 | 30 |
Table 1: Means and medians for usefulness ratings of eleven mobile apps for online clothes shopping.
In this example, all the medians were either 4 or 5. The means, on the other hand, ranged from 3.57 to 4.64 with no duplication, providing a much more nuanced picture of the differences in the ratings (Figure 2).
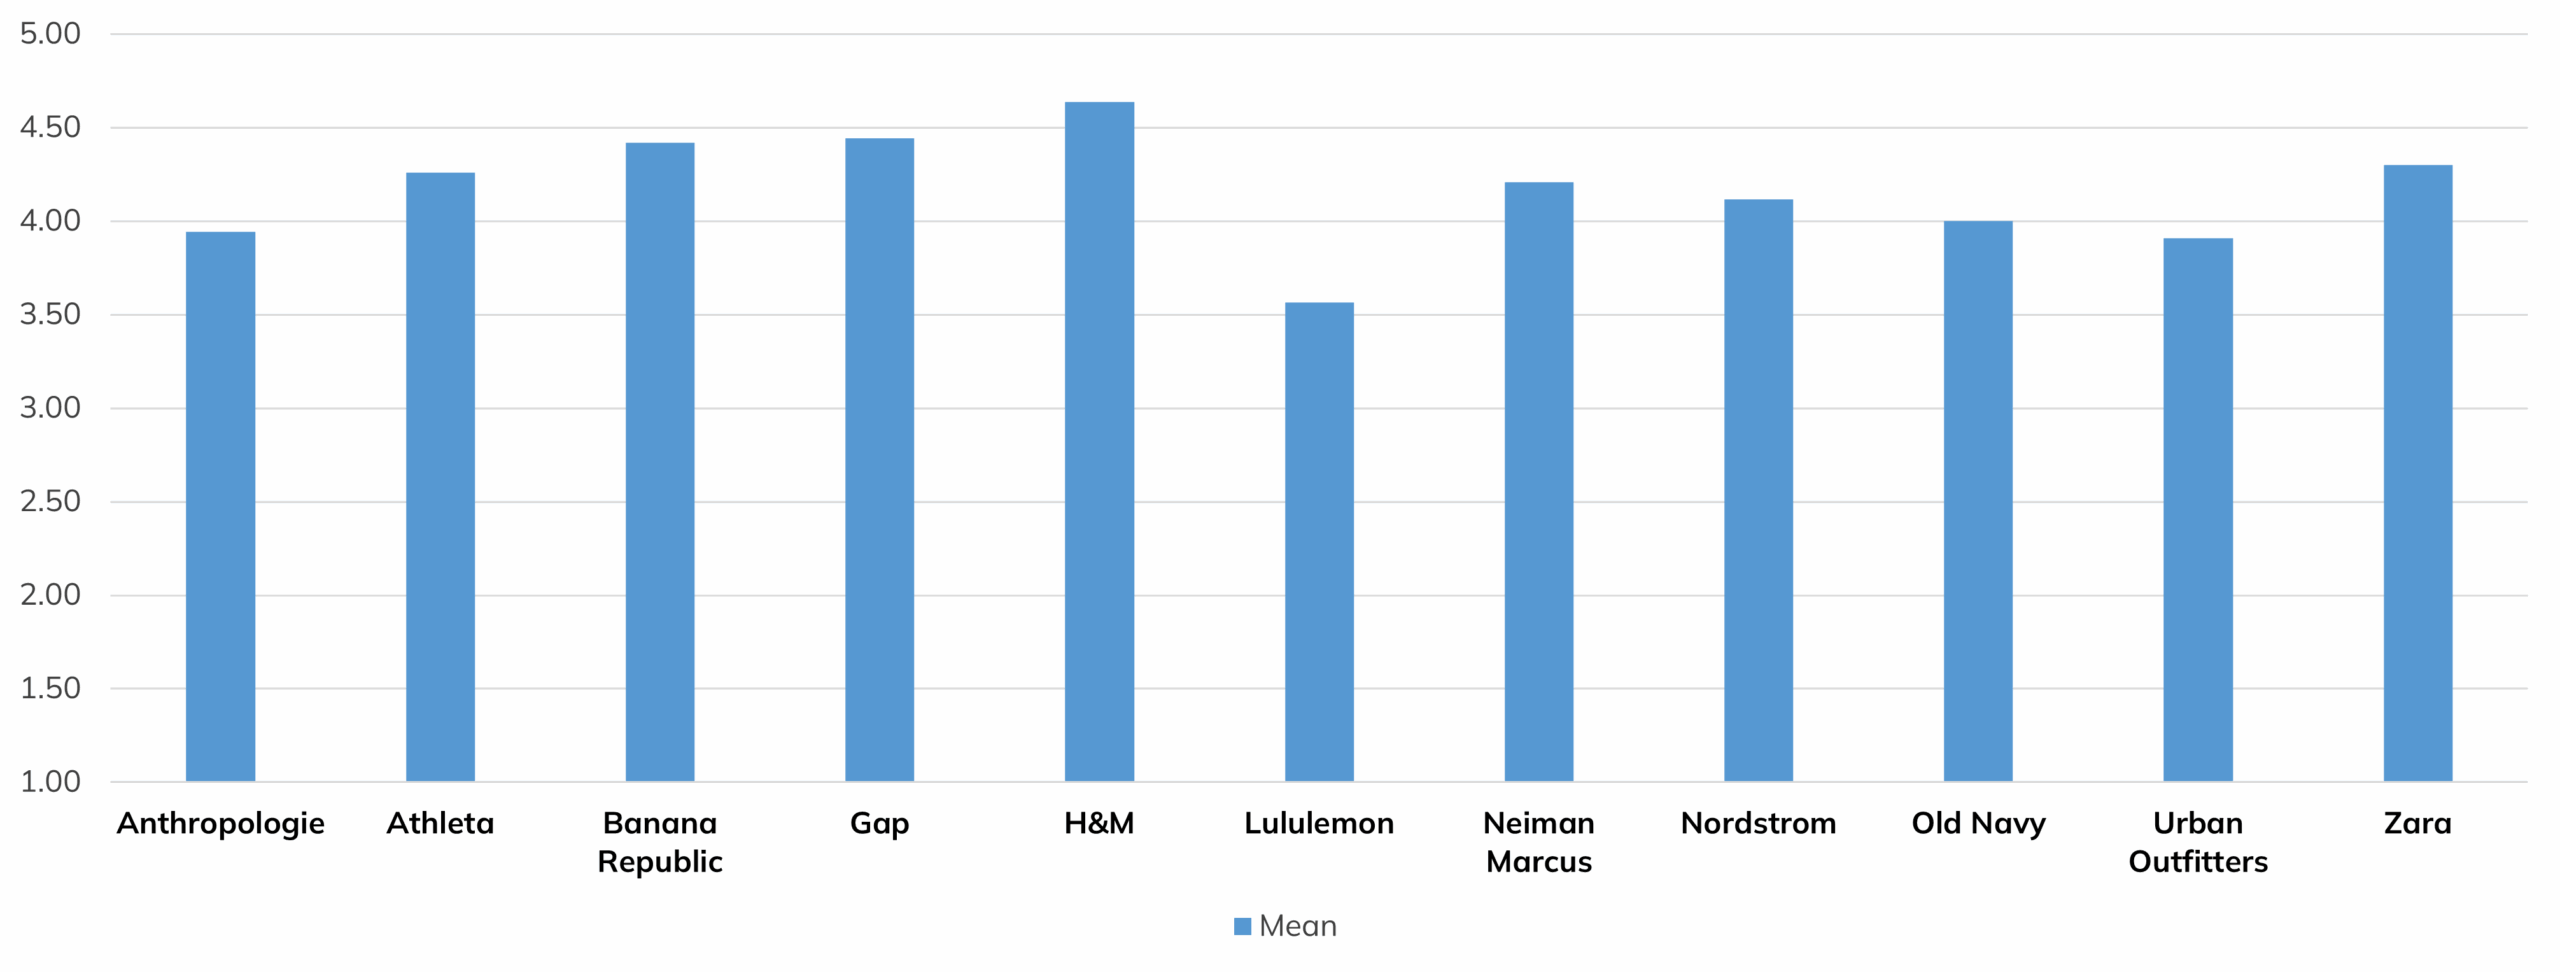

Figure 2: Comparison of graphs of means and medians for usefulness ratings of eleven online clothes shopping apps. The profile of the means is more informative than the profile of the medians.
And when sample sizes are very small, there usually won’t be much difference between rating scale means and medians. The most extreme example is when n = 2, in which case the mean and median will be the same, but that doesn’t happen in the real world.
Use Means, But Don’t Overinterpret Them
So, which is it—not all numbers are equal (Stevens, 1946), or the numbers don’t remember where they came from (Lord, 1953)? Given our backgrounds in applied statistics (and personal experiences attempting to act in accordance with Stevens’ reasoning that didn’t work out very well—that’s a story for another day), we fall firmly in the camp that supports the use of statistical techniques (such as the t-test, analysis of variance, and factor analysis) on ordinal data such as multipoint rating scales. However, you can’t just ignore the level of measurement of your data.
When you make claims about the meaning of the outcomes of your statistical tests, you must be careful not to act as if rating scale data are interval rather than ordinal. An average rating of 4 might be better than an average rating of 2, and a t-test might indicate that, across a group of participants, the difference is consistent enough to be statistically significant. Even so, you can’t claim that it’s twice as good (a ratio claim), nor can you claim that the difference between 4 and 2 is equal to the difference between 4 and 6 (an interval claim). You can only claim that there is a reliably consistent difference.
Although it might surprise some researchers who treat the implications of the levels of measurement as if they were laws, Stevens (1946, p. 679) took a more moderate stance on this topic than most people realize:
On the other hand, for this “illegal” statisticizing there can be invoked a kind of pragmatic sanction: In numerous instances it leads to fruitful results. While the outlawing of this procedure would probably serve no good purpose, it is proper to point out that means and standard deviations computed on an ordinal scale are in error to the extent that the successive intervals on the scale are unequal in size. When only the rank-order of data is known, we should proceed cautiously with our statistics, and especially with the conclusions we draw from them.
Fortunately, even if you make the mistake of thinking one product is twice as good as another when the scale doesn’t justify it, it would be a mistake that often would not affect the practical decision of which product is better.
Summary and Discussion
Some analysts strongly advise against computing the means of rating scales, often recommending the computation of medians instead. In this article, we explain why reporting the median of rating scale data doesn’t work as well as reporting the mean.
Medians are better than means when outliers skew continuous, unbounded data. This pattern is common in measures such as time or money, where a few extreme values can substantially shift the mean.
Rating scales are discrete and bounded, making means more informative than medians. Even though we spend a lot of money and time collecting data, rating scales aren’t like time and money. For data like this, medians are too coarse to capture the meaningful differences that means are sensitive enough to detect.
Compute means of rating scales, but don’t make interval claims from ordinal data. Differences between rating scale means indicate consistent ordering, not equal intervals or proportional differences. Even so, they are often very useful in practice.
Bottom line: When analyzing rating scale data, don’t be afraid to compute and compare means as long as your interpretation of results doesn’t exceed what the data says.