 Shift happens.
Customer attitudes shift based on product, website, or any number of experiences.
That shift can be for the better or worse:
- A great experience using a product to solve a problem
- An infuriating call to customer support
- An emotionally evocative advertisement
- A frustrating time locating information on a website
One way to understand how particular experiences impact attitudes is to measure lift.
Lift is the general name used to describe the difference between attitudes before and attitudes after some stimulus. Lift can be both positive (an improved attitude) or negative (a reduced attitude). I talk about lift in Chapter 9 of Customer Analytics for Dummies.
Brand lift is one of the more common lift measures, but almost any attitude can be measured: satisfaction, perception of usability, attractiveness, likelihood to recommend, and likelihood to purchase, to name a few.
We often like to understand how a website experience helps or hurts brand favorability ratings (brand lift). For example, in a study we conducted of the Enterprise and Budget rental car websites, customers were asked to rate their attitude toward each of the two rental car brands prior to and after renting a car through each website. We used a 7-point scale from 1 = very unfavorable to 7 = very favorable.
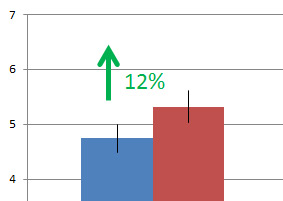
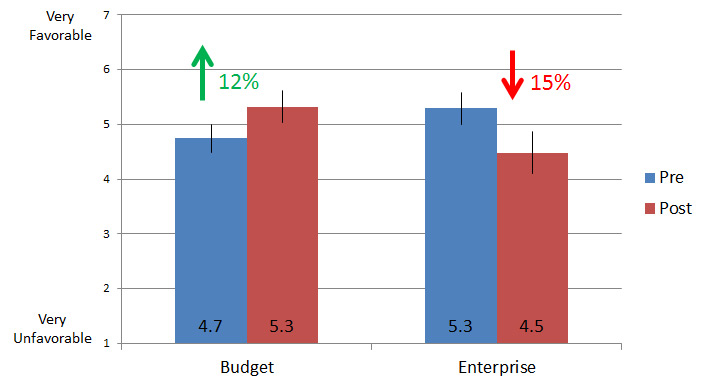
As shown in Figure 1, the brand favorability rating for Budget increased 12%, on average—from 4.7 to 5.3. The brand favorability rating for Enterprise decreased 15%, on average—from 5.3 to 4.5.

Figure 1: Brand favorability before and after renting a car through the website. Budget lift was 12% and -15% for Enterprise.
The negative lift for Enterprise suggests that the website experience hurts customers’ attitudes toward the brand. Since attitudes tend to affect actions, it’s likely that continued degradation of the attitude toward the brand will result in reduced business.
Other study data revealed the likely causes of Enterprise’s negative lift: customers couldn’t add options (GPS, car seat) without difficulty, and they couldn’t find the final rental price of the car at all (because it wasn’t shown!).
Computing Lift
Computing lift is pretty straightforward and is usually expressed as a percentage. Use the following three-step-process to compute lift:
- Subtract the before from the after attitude measure. For Enterprise: 4.5-5.3 = -0.8
- Divide the difference by the before score: -0.8/5.3 = 0.15
- Multiply by 100: lift = -15%
Factors Affecting Lift
Our research shows that brand lift is especially affected by these two factors:
- Experience. Customers’ prior experience with a product or brand tends to affect how malleable their attitudes are. We’ve seen this phenomenon with attitudes toward usability too. When customers have more experience with a product, their lift scores are less impacted by new stimuli (like a usability test). In contrast, customers with little or no prior experience with a product or website often show the biggest changes (often higher) for lift.
- High favorability. We’ve seen cases where customers with very high favorability toward a brand usually have slight negative lift after they have an experience with a website or product in one of our studies. While this needs more research, we hypothesize that some customers have such lofty attitudes toward a brand and its touchpoints (websites, products, ads), that there’s nowhere for those attitudes to go but down (albeit slightly). As such, we’ll often see modest negative lift for the most enthusiastic customers (think Apple customers).
Summary
Lift is a great way to show how an experience impacts customers’ attitudes. It can be positive or negative and is likely affected by customers’ history with the product or website. Customers who have high prior favorability may show slight negative lift—not necessarily because their new experience is bad but because scores have nowhere to go but down.


