 If you’ve considered using unmoderated remote usability testing with video here are answers to several questions you might have.
On February 28th 2012, I hosted a live webinar sponsored by the folks at Userzoom and Usertesting.com.
The topic was best practices for unmoderated usability testing and in it I walked through the results of a comparative usability benchmark analysis I conducted.
We had 61 users attempt the same two tasks on Enterprise.com and Budget.com (two leading rental car websites) and had the audio and screen recorded.
We filled up all available slots so if you missed the webinar you can view a recording of it and download my slides. We had a lot of questions that didn’t get answered so here they are:
-
-
Technically speaking, is there anything to do on the tested website for the test to work?
You don’t need to do anything on the tested website. To collect click-paths and generate heat-maps you will need to have the user download a small active-x plugin which most users don’t seem to mind. If you have control of the site you can insert a single line of javascript which removes that step.
-
Is it possible to recruit participants on the fly, for instance, they visit the website and are prompted if they want to participate in the study right now ?
Yes, this can be one of the best places to find qualified users (they are on your site!). However, I recommend if you are recruiting on the fly, limit your study to a few minutes or just a screening survey. This can be an excellent way to collect users who qualify for a future study and when your volunteers have more like 20-30 minutes of dedicated time.
As a final consideration, I often prefer using separately recruited users who are comfortable being recorded. The clear disadvantage is you get some “professional users” who are only in it for the honorarium or may behave differently than your target users, but you also reduce the number of users who aren’t comfortable thinking aloud and having the screen and clicks recorded.
If you are testing a competing website, it also reduces the liability of you introducing YOUR customers to alternatives which may be better! Sometimes testing a mix of both panel recruited and website recruited offers a good balance of data and perspective.
-
How do you decide how many users to have in a study?
I usually spend half a day in one of my courses answering this question and we will offer a section at the LeanUX Denver conference, but here are some pointers. The first thing you need to do is answer this question:
What type of test are you conducting?
A. Are you making a comparison (to another product, design or benchmark)?
B. Are you estimating a parameter of a population (the average task-time, the average completion rate, the proportion of users that will recommend my product)?
C. Are you trying to detect usability problems in an interface?If your test is Type C, see the article How to find the right sample size for a Usability Test.
If you answered Type B, then your sample size comes down to these additional factors:
The metric(s) you are collecting: Continuous metrics like task-time and rating-scale data require a slightly smaller sample size than discrete-binary data like completion rates.
The level of precision you want in the metric(s) : This is expressed as a margin of error (which is half the confidence interval). Do you want to estimate your metric to within +/- 20% ; +/- 10%, +/- 5% or another level of precision? In general, the sample size needed to achieve your level of precision is inversely proportional to the square root of the sample size. That means if you want to cut your margin of error in half (e.g. to go from +/- 20% to +/- 10%) you need to roughly quadruple your sample size. See the article: Margins of Errors in Usability tests.
The confidence Level: This is how confident you need to be that the population parameter will fall within your margin of error. It is usually set to 95% by convention, but 90% or 85% are fine for industrial applications.The amount of variability in the metric(s)—as measured by the standard deviation. You need to have some estimate of the standard deviation (from previous studies or benchmarks). For binary completion rates you just need to estimate the proportion you’d expect to see (which is how the standard deviation is calculated).
The easiest thing to do is use binary completion rates (which are the same as conversion rates or agree/disagree proportions) and estimate the sample size needed assuming the highest amount of variability (when the percentage is at 50%). So we just work backward from the margin of error calculation for a confidence interval assuming a 95% level of confidence. The table below shows you some common levels of precision and sample size needed.
Sample Size Margin of Error (+/-) 10 27% 20 20% 30 17% 40 15% 50 13% 90 10% 115 9% 150 8% 200 7% 260 6% 380 5% 600 4% 1000 3% For example, at a sample size of 50, the expected margin of error will be 13%. That means if 70% of users can complete a task such as finding the address of the nearest location, we can be 95% confident between 57% and 83% of all users would be able to complete the same task under the same conditions.
The margin of error will be slightly lower for the task and test-level satisfaction metrics. For sub-group analysis (e.g. done by gender or level of experience) the margin of error will be based on the sub-group size, not total sample size.
If you answered Type A, then you need to consider six things to determine your sample size:
The metric(s) you are collecting (See B above)
The Confidence Level (See B above)
The amount of variability in the metrics (See B above)
Between or Within Subjects: If users attempt tasks on both design alternatives you remove the variability between participants and it allows you to detect smaller differences with smaller sample sizes (within-subjects). If you are unable to use a within subjects design (because of time or constraints in using both designs) then you need different users (between-subjects). You typically need between 2 and 4 times the sample size for between-subjects studies compared to within subjects studies (this is mainly due to the large amount of individual difference between how people behave).
How large of a difference you want to detect: Based on the metric you are collecting, you need to define how large of a difference plausibly exists between the two alternatives. You can detect large differences with a smaller sample size but need a large sample size to detect small differences. For example, a difference of 50 percentage points (e.g. 30% vs 80%) is a large difference. A difference of 10 percentage points is a small difference (e.g. 70% and 80%) and requires a larger sample size. These differences are often expressed in standardized units called effect sizes.
Power: How confident you want to be that if a difference does exist, you’ll be able to detect it. By convention this is set to 80%.
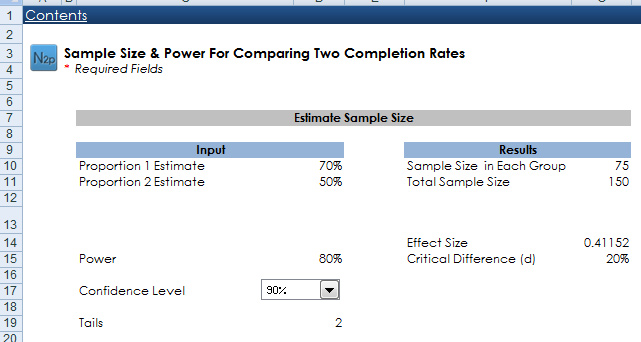
For example, the sample size needed to detect a 20 percentage point difference, assuming a 90% confidence level, 80% power and completion rates that are between 50% and 70% with different users in each group you should plan on a sample size of 150 (75 in each group). The screen shot below comes from the Usability Statistics Package Expanded Calculator.
-
What if you don’t want to compare – how many users then?
-
If you are not making a comparison in a benchmarking study then you are conducting the Type B study from above. The sample size you need is then based on how precise you want your estimate to be and the type of metric you are collecting.
For example, if you want to have a margin of error of +/- 5% around your completion rates, you should plan on a sample size of 380, assuming the completion rates hover around 50%. See the response above in #3 for Study Type B.
-
Can you use this to do a longitudinal study, so that you see the same participant’s interactions over time?
Yes, if you conduct a benchmarking study (even a comparative one like I did) you can then make design changes and test the effects in say six months. This is a common scenario. In fact, as I alluded to in my presentation, we tested Budget.com back in 2009[pdf] and it took users about 10% less time to complete the same task in 2012 (134 vs 150 seconds).
The reason was Budget implemented a type-ahead location feature which meant few users had to search for the correct rental location.
-
Did you consider grabbing users from the site itself (ethnio or OpinionLab popups)?
This can be a low cost way of recruiting users, but because this study was unaffiliated with either rental car company we were unable to pull visitors from either website. See #2 above.
-
Can you follow up with a participant (phone or email) and ask them specific questions about what/why they did something during the test?
Yes. Usertesting.com, which provided the participants, allows you to send an email or follow up questions to the participants. This can be particularly helpful when you see something in the video and want to follow up.
-
When would you not recommend URUT? What are some of the shortfalls of URUT?
For usability tests that require a lot of vigilance and time or where the application being tested doesn’t lend itself well to Unmoderated Remote Usability Testing (URUT). For example, testing desktop-based anti-virus software comes to mind as well as testing mobile devices.
If the test starts taking more than about 35 minutes, you also start to get fatigue issues and have more difficulty recruiting users. So Unmoderated Remote Usability Testing isn’t a one size fits all solution to all usability testing scenarios.
-
How do 61 users statistically represent a population of hundreds of thousands?
This is a common question and it touches on the issues of representativeness (being sure you’re testing the right users) and the precision of your estimate. Your sample can be representative if you have only say 3 users, but it won’t be very precise. This issue also touches on sub-group sampling.
If you need to sample users, for example, from five different products, then you would need at an absolute minimum 5 users (1 from each product). For this study we were interested only in participants who would likely rent a car from either website and so we included only users above age 25 living in the US. About 40% of the participants reported having been to both websites at least once. See the article: What is a Representative Sample Size for a Survey?
-
Isn’t time on task suspect given differences in network connectivity and latency issues the users may have experienced?
Network connectivity and latency certainly are issues that can affect task time, but that’s fine as this represents a more realistic testing scenario. There is a common concern when measuring time on task that if we aren’t using a controlled lab environment, then the average time we collect is wrong. I would argue that the more relevant time isn’t the one from the fast internet connection in a sterile usability lab, but rather a representative sample of how users will actually experience the website (this also includes their browsers and resolution). What’s more, network delays are usually dwarfed by the massive differences between users.
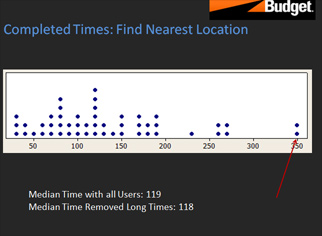
In this study, like most others I’ve conducted, it’s not that one user has a slower connection than another; it’s that one user takes a lot more time to complete the task. Some users are just more deliberate in their navigation and selections and can take much longer to complete the task. For example, we had one user in the study take 350 seconds to find the nearest rental car location (see the screen shot below). When we reviewed the video, we saw that this user was just slow and deliberate. They likely represent a subset of users that are out there.
Finally and most importantly, testing two websites with the same users allows you to control for both individual differences in users and network latency. Instead of focusing on what the “right” task time is, you focus on the difference between websites. For example, it took the same users almost twice as long to rent a car on Enterprise as on Budget. See the articles Will the real task time please stand up? and 5 Benefits of Remote Usability Testing: Measuring Usability
-
Don’t you need admin rights to activate that Userzoom plug-in? If you’re using a corporate computer, you often don’t have admin rights.
Kim Oslob from Userzoom answered this one: For the browser add-on (plug-in) you do need admin rights to activate. There are several alternatives to handle this, as many of our clients do. If conducting internal studies, have your IT dept roll out the UZ specific add-on throughout the company.
If conducting external studies consider using a panel provider to ensure you reach customers that do not have this issue. If using a list that this is a possible known issue, consider using JS tracking or in the Welcome Screen advise participants to participate from home outside of the firewall.
-
Love the combination of UserTesting and UserZoom. This is great for public websites, but some or ALL of my tests are on web sites within our corporate firewall. Are there any issues with using either of these tools for this type of environment?
Kim Oslob from Userzoom answered this one: There are no issues with using UserZoom as long as the participants are behind the firewall. See above answer for participants internally participating with strict browser restrictions.
-
When you analyzed the verbatim responses, did you simply categorize them through brute force? Or did you have any sort of automated method? Obviously not a big deal with 60 comments, but what if you had 100’s or 1000’s?
For this study and most studies it is brute force. It does take a good chunk of time but I find worth it. Fortunately having done this a number of times and having the task metrics, you tend to see a lot of similar comments and have ideas about categories which makes it go a bit faster. Working in pairs also helps.
-
I like your method for presenting time on task. How much importance do you place on click rate?
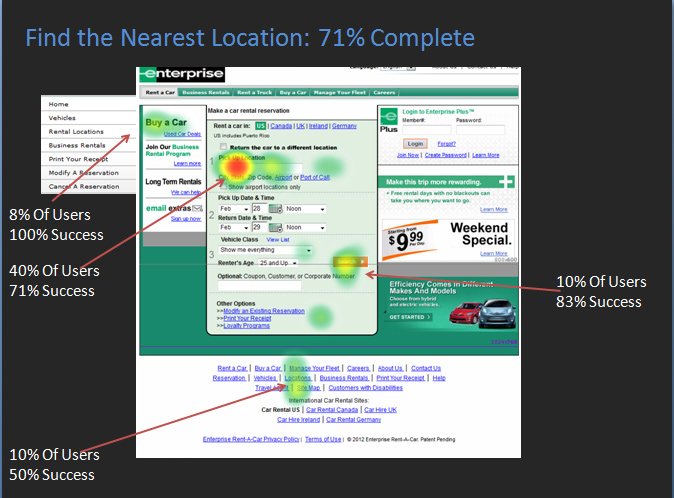
As a measure of efficiency I prefer time on task. However, the number of clicks on particular elements by itself can be extremely valuable. For example, in this study we saw that only 8% of users’ first click (see the screen shot below) was on the primary navigation (a sort of click-rate). This provides strong evidence that users aren’t noticing this element in the navigation and could use some redesigning.
-
Do you think that thinking aloud may have affected task completion and time on task calculations?
The research on thinking aloud studies shows mixed results. Some research shows that users are actually faster when they think aloud. Note that we weren’t probing the users (stopping them mid-task to ask questions).
Some users verbalize more thoughts than others; however, we are interested in the difference in task-time between websites so the variability between users is spread evenly across websites. In my experience, I’ve noticed that the Usertesting.com users also tend to be pretty good at both articulating their thoughts and still staying on task. This is one advantage to using their prescreened panel versus recruiting users from the website. See also #10 above
-
How many participants do you recommend for a within subjects benchmarking study?
This is the study Type A from #3 above and is what I used in the Enterprise and Budget comparisons. To answer this question you really have to consider how large or small of a difference plausibly exists between the products or designs you are testing. If there are likely large differences, then you can have a smaller sample size, for smaller differences you need a larger sample size.
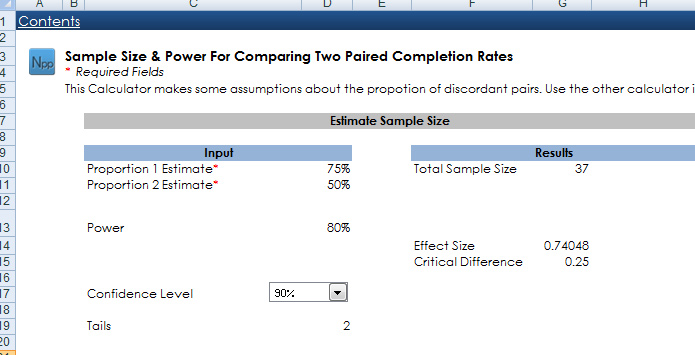
If you are collecting multiple metrics in the study, which I recommend (like completion rates, task times and satisfaction metrics), then you base your sample size on completion rates which are discrete-binary and require a larger sample size to detect differences. Let’s assume a 90% confidence level and 80% power and you estimate that there is probably a large difference between products of say a 25 percentage point difference. If we assume one task has a completion rate of 50% and the other at 75% we would need a sample size of 37. The screen shot below shows the results and comes from the Usability Statistics Package Expanded Calculator.
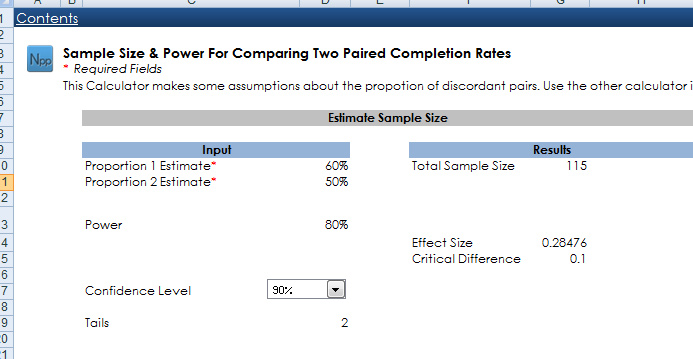
If we think the difference is more modest (say 10%) but the completion rates were close to 50%, then we’d need a sample size of 115 to have an 80% chance of detecting that difference and be 90% confident the different we detect isn’t due to chance alone. These calculations are explained in Chapter 7 of Quantifying the User Experience and in the Excel and R Companion Book.
Often times the time you have to test will dictate your sample size. In a recent early stage redesign of a large eCommerce homepage, we had 1 week to do the 1st round of testing. We only had time to test 13 participants. We wanted to find out if the new design would take users more or less time to find navigation elements than the existing website. I again used a within subjects design and had the same users attempt the same tasks on both the old and new website.
A third of the 12 tasks (some better some worse for the new design) we found as statistically different—which means there were quite large differences in average times. We were using task-time as the key metric there, which is a continuous measure and requires a smaller sample size than a discrete binary measure. But even then tasks which were not statistically different gave us evidence that at least we weren’t making it much harder for the user even though a radically different look was being introduced.
-
What statistical test was used to measure task completion and time on task?
For time-on task we used a paired t-test. For task-completion we used a statistical test called the McNemar Exact test using mid-probabilities (see the screen shot below). The procedure is included in the Usability Statistics Package Expanded Calculator.
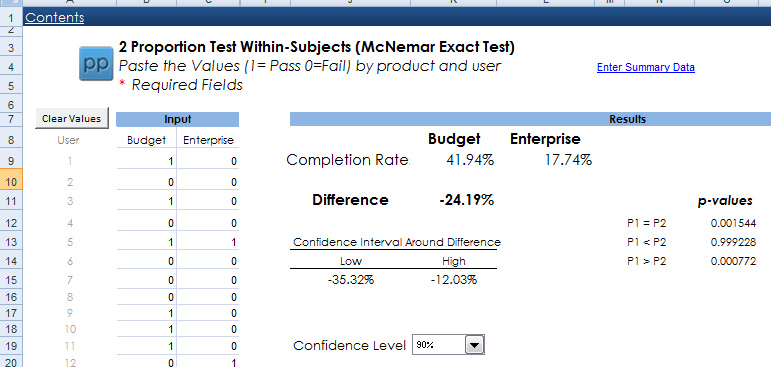
Both procedures are detailed in Chapter 5 of our book Quantifying the User Experience. We also show you how to perform these calculations using R and the Excel calculator in the companion book which can be downloaded now.
-
Can you give us an idea: (1) how you landed on the sample size of 61 (2) How much time you allowed (and how many people) to conduct analysis and reporting for a study of this type and size – Thanks!
The sample size of 61 came from balancing both the time we had to conduct the study and the size of the difference that likely existed in completion rates between Enterprise and Budget. Having tested both websites back in 2009, we saw about a 20% difference in the lab when users had more time. We limited the time on each task to 5 minutes (so the entire study was less than 30 minutes) so we expected a few less users to be able to complete the task.
We used this 20 percentage point gap as our best estimate that likely existed between the websites and figured around 80% would complete on budget and 60% on enterprise. This led to an estimated sample size of 45 (see screen shot below), so we rounded up to 50 and ended up getting 61 before we shut down the study.
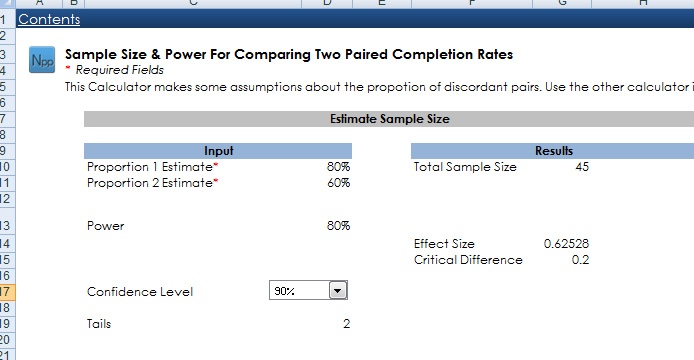
As it happens the difference between completion rates for the rental car task was 18% versus 42% (see the screen shot in #17), so a lot fewer users were able to complete the task, but this difference was statistically significant and for future studies we’ll use those as the new completion rates when estimating sample sizes.
As far as the level of effort for this study, the total duration was four weeks, and that includes planning, pretesting, execution, analysis and presenting. During those four weeks we had two people working on the study. The bulk of the effort came in reviewing the videos, coding and documenting the usability problems and making the statistical comparisons. When I conduct these studies for clients the study typically takes between 6 and 10 weeks, with a lot of time spent on deciding which tasks to use and what parts of the website to test.
-
How do you conduct a pretest of tasks? Do you do a remote unmoderated test with a very small sample size? How do you find out how to tweak wording of tasks?
Exactly. We did a soft-launch of the study with 5 participants and made a few changes to the task-wording and we even tossed out two tasks because the total study time was too long. We did this after having two people in our office do a sanity check on the tasks and caught some other issues (missing information in the tasks).
-
How are NDAs handled for proprietary information?
In this particular study there weren’t any disclosure issues so we didn’t need a Non Disclosure Agreement (NDA). The study was not commissioned by either one of the websites being tested.
