Would you recommend your cell-phone to a friend? How about the rental car company you just used? Customer loyalty is an important attribute of a product or service’s long-term viability. There are many ways to measure the construct of customer satisfaction and loyalty and they usually involve questionnaires, such as the American Customer Satisfaction Index . One of the more popular methods is something called the Net Promoter Score (NPS).
The NPS is based on only a single question: “How likely are you to recommend this product to a friend or colleague?” The response option is an 11-point scale numbered from 0 to 10 with higher numbers indicating higher likelihood to recommend. Promoters are those who choose a 9 or 10, detractors are those who choose anything 6 and below, with the 7-8’s as passive. The ‘Net’ in net promoter comes from how you score the response. You subtract the percentage of detractors from the percentage of promoters to get your Net Promoter Score. The idea is that these more extreme responses tend to result in customers who will use word of mouth to either praise or trash your product or service. It has been reported that this one question is a good predictor of a company’s long term growth [PDF].
The NPS is not without controversy as some question its predictive ability and reliability. In general when you want to measure a construct such as loyalty, usability or satisfaction you will have a more reliable measure by asking multiple questions than relying on a single question. Nonetheless it has become popular with many businesses for its simplicity and intuitiveness, and single questions can still be very informative[PDF].
What drives loyalty?
We all want higher customer loyalty, so knowing what “levers” move the loyalty-needle is important. If you can make changes that will increase loyalty, then increased revenue should follow. So, do improvements in usability increase customer loyalty?
To find out, I took one of the more popular measures of perceived usability, the System Usability Scale (SUS) [PDF] and performed a regression analysis against Net Promoter scores. In total, I examined responses from 146 users from about a dozen products such as rental car companies, financial applications and websites like Amazon.com. The data come from both lab-based usability tests and surveys of recent product purchases where the same users answered both the SUS and Net Promoter question.
The Net Promoter score and SUS have a strong positive correlation of .61, meaning SUS scores explain about 36% of the variability in Net Promoter Scores. The regression equation is:
NPS = 0.52 + 0.09(SUS)
So a SUS score of a 70 will generate an approximate Net Promoter Score of about a 7 and a SUS score of at least an 88 is needed to be a promoter (9+).
SUS Scores for Promoters and Detractors
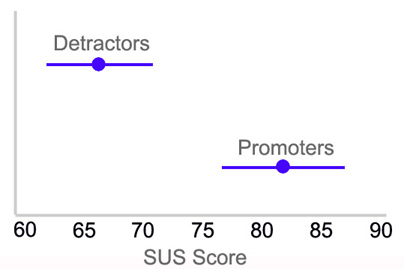
Another way to look at the data is to see what the SUS scores are for promoters and detractors. Promoters have an average SUS score of 82 while detractors have an average score of 67 (p <.01). If you’re looking for a SUS score to aim for, I’d say anything above an 80 would put you safely in the promoter range.

Figure 1: Mean and 95% Confidence Intervals for SUS scores for NPS Detractors and Promoters.
It’s not too surprising that Net Promoter scores and usability questionnaires correlate highly; after all, the questions are very similar. One SUS question is “I would imagine that most people would learn to use this system very quickly.”
Of course usability questionnaires aren’t the entirety of usability, in fact, they are probably only about 1/3 of usability (as well as the ISO 9241 pt 11 definition). Usability is also measured using task-based performance metrics such as task-time and completion rates. These metrics have only a small correlation with post-test usability questionnaires [PDF] such as SUS and the Net Promoter (Sauro & Lewis 2009).
Despite usability questionnaires providing only a partial picture of usability, they are nonetheless important. In fact, you could argue a user’s perception of an application’s usability is more important than actual task performance—a sort of gateway measure of usability. This data suggest that improving usability will have a substantial impact on your customer loyalty. Overtime, if people think your product is usable then they are more likely to use it, more likely to recommend it and you are more likely to sell it.


