 In an earlier article, we reviewed when and why to use click testing. Click testing involves presenting images to participants and tracking where they click based on tasks participants are asked to complete. It’s typically administered using a tool like the MUiQ® platform.
As we cover in our short course, click testing tends to be used in the design and release phases of product development, and it generates mostly quantitative data.
Our earlier analyses also showed how click testing provides a reasonable approximation for how people would click on a live website or live product pages (especially when the live web page doesn’t contain dynamic elements).
Click testing can be thought of as a specialized type of usability testing (defined by the ISO specification of usability). Therefore, essential click-testing metrics, like usability metrics, can be classified as:
- Effectiveness (e.g., location, success rate)
- Efficiency (e.g., completion time, number of clicks)
- Perception/satisfaction (e.g., SEQ, confidence, preference)
These metrics provide quantitative support for visually interpreted representations such as click maps and heat maps. Software like the MUiQ platform makes it relatively straightforward to see where people click or don’t click on images.
Beyond just eyeballing the data, how do you correctly analyze click-testing metrics? The answer depends on the study setup and your research questions. In this article, we’ll walk through the steps to analyze the data you’ve collected for common research questions addressed with click testing.
We’ll use data from our earlier click-testing study in which participants attempted to locate information across five homepage website images: Creative Commons, NASA, Disqus, IKEA, and California Parks.
There are two main ways to analyze click-test data: stand-alone analyses and comparative analyses. In stand-alone analyses, you use confidence intervals around your sample of data to infer the plausible range of a population parameter like a mean or proportion. In an upcoming article, we’ll cover how to make comparisons with click-testing data (assessing differences in click patterns).
To know which one to use, we’ll start with the research questions and the metric used. When using the MUiQ platform, many of these computations are done automatically. Otherwise, you can use statistical packages or online calculators.
Stand-Alone Analysis (Confidence Intervals)
As the name suggests, a stand-alone analysis involves summarizing a metric from a sample to make inferences about the larger population of users who were not sampled. To do this, you provide an average or percentage (called a point estimate) and generate a confidence interval around this value to provide the plausible range within which the average would fluctuate if you were able to sample the entire population.
There are two types of confidence intervals for click-testing metrics—one for percentages (the adjusted-Wald binomial confidence interval) and one for rating scale and time data (the t-confidence interval, using a log transformation when analyzing time data).
Below are common research questions for the three types of metrics and examples of their corresponding confidence intervals. These examples come from our image versus live site click comparisons of five websites: Creative Commons, NASA, Disqus, IKEA, and the California State website.
Effectiveness Measures: Percentages
The following are examples of research questions measuring effectiveness that use percentages:
- What percentage of people click on a designated part of the image (often called a hotspot)?
- How many participants have a successful first click?
- How many participants scroll down and click “below the fold”?
How to Analyze
To analyze percentages, we recommend computing adjusted-Wald binomial confidence intervals. They can be computed using our online calculator for binomial confidence intervals, or the intervals can be automatically generated in our MUiQ platform.
Although some of the example research questions above could be interpreted as asking about total numbers (e.g., “How many participants …”), it’s more useful to report percentages even when sample sizes are small (dividing the number of participants who made the designated click by the total number of participants who were exposed to the image, thus having an opportunity to click). This percentage applies to the larger population that will eventually get exposed to the image (e.g., usually a web page).
For example, in our study on testing an image of the NASA home page, we wanted to know what percentage of participants would click on the “About” or “History” menu items shown in Figure 1.
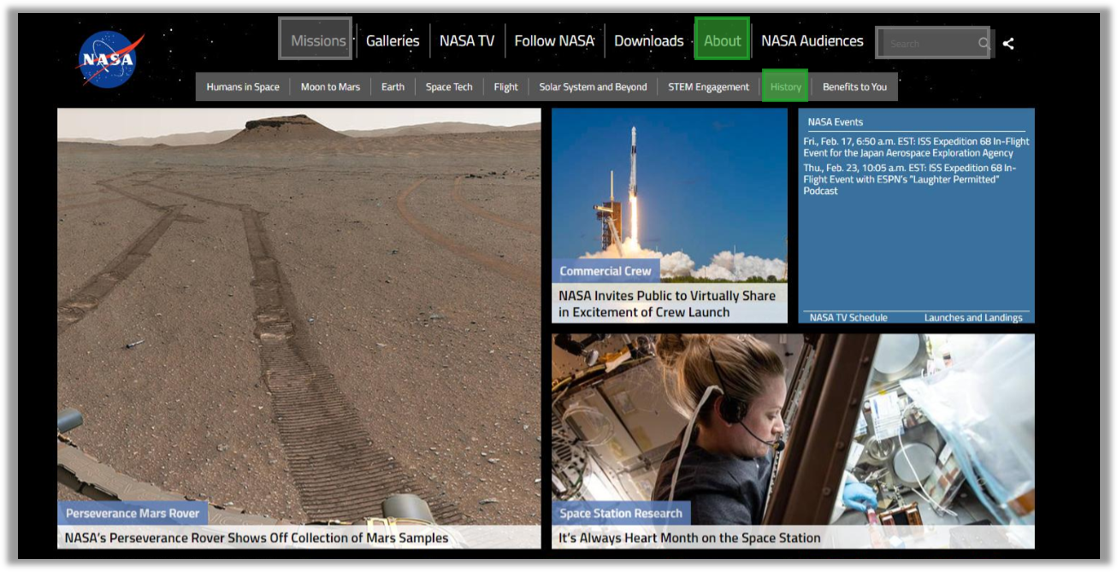
Figure 1: Image from the Nasa.gov website with “About” and “History” hotspots identified.
Online calculator. Of the 62 participants who attempted to click on the optimal locations on the NASA homepage image, 57 were successful. Figure 2 shows the 90% adjusted-Wald binomial confidence interval from our online calculator for the task success rate for the image of the NASA site (determined by whether a participant’s first click was on a valid area of interest on the image).
The calculator shows results for four different methods, but for these types of analyses, we recommend reporting the maximum-likelihood estimate (MLE) as the observed percentage and the adjusted-Wald method for the confidence interval (inside the green boxes in Figure 2). For these data, the observed percentage (MLE) is 91.9%, with the adjusted-Wald interval ranging from a low of 84.1% to a high of 96.3% (shown as ratios rather than percentages in the calculator).
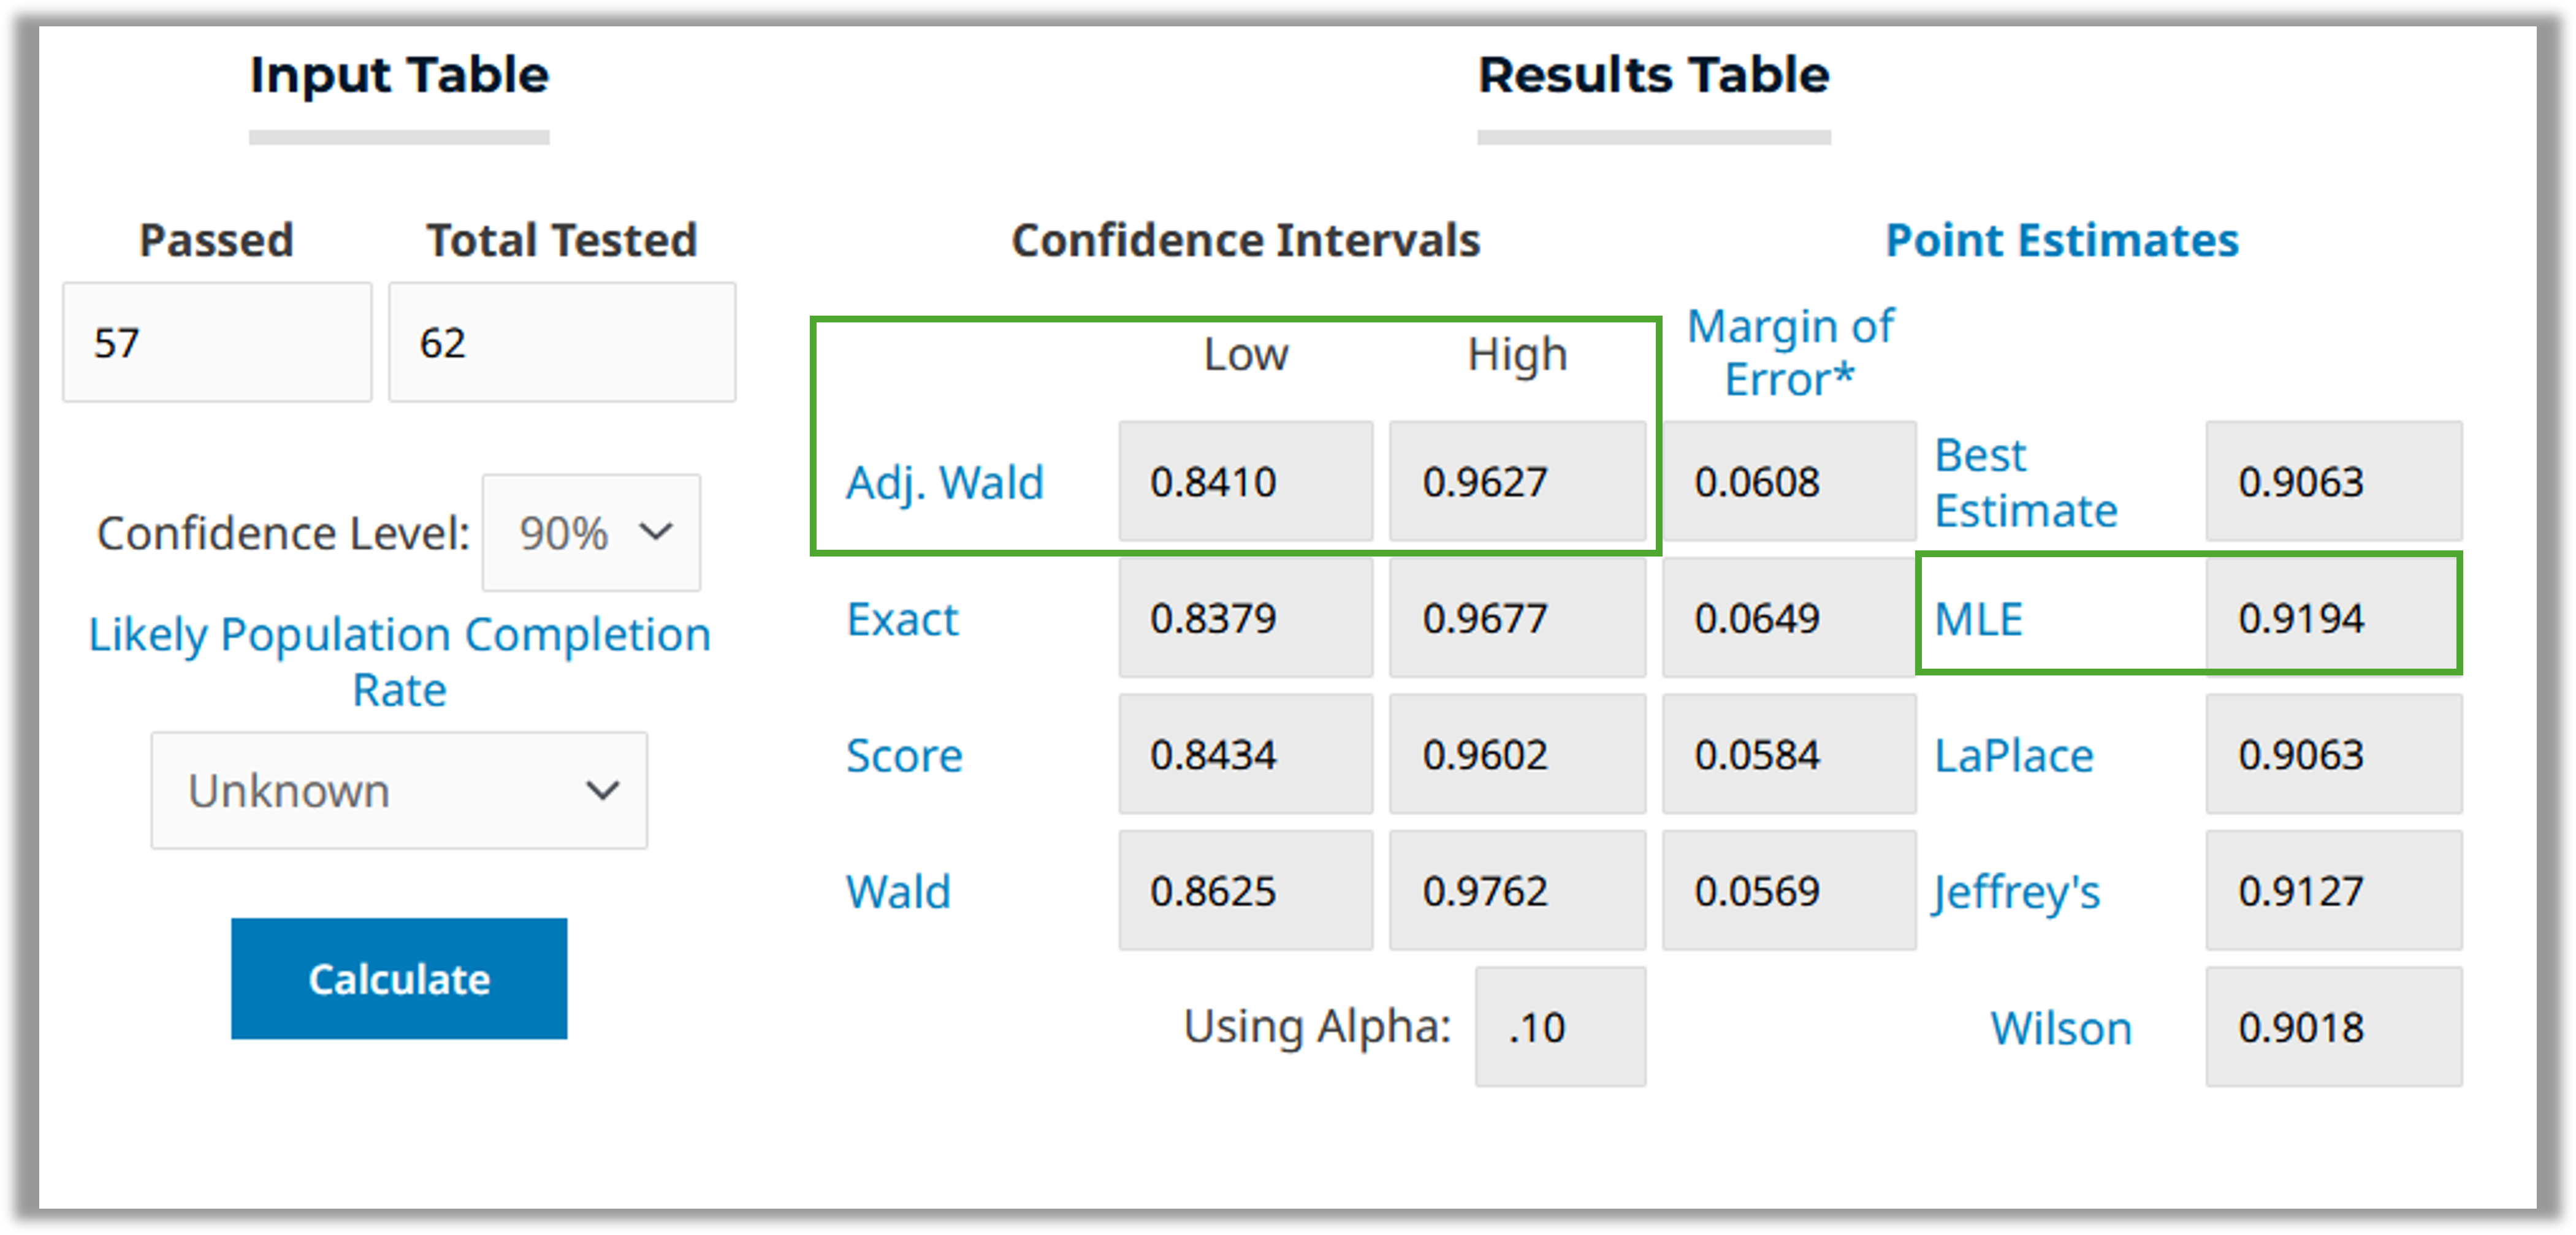
Figure 2: 90% confidence interval for the NASA image condition’s 57 successes out of 62 attempts using our online calculator.
MUiQ platform. Figure 3 shows the success rate analysis downloaded from the MUiQ platform with 90% adjusted-Wald confidence intervals for all five websites in both experimental conditions (image and live).
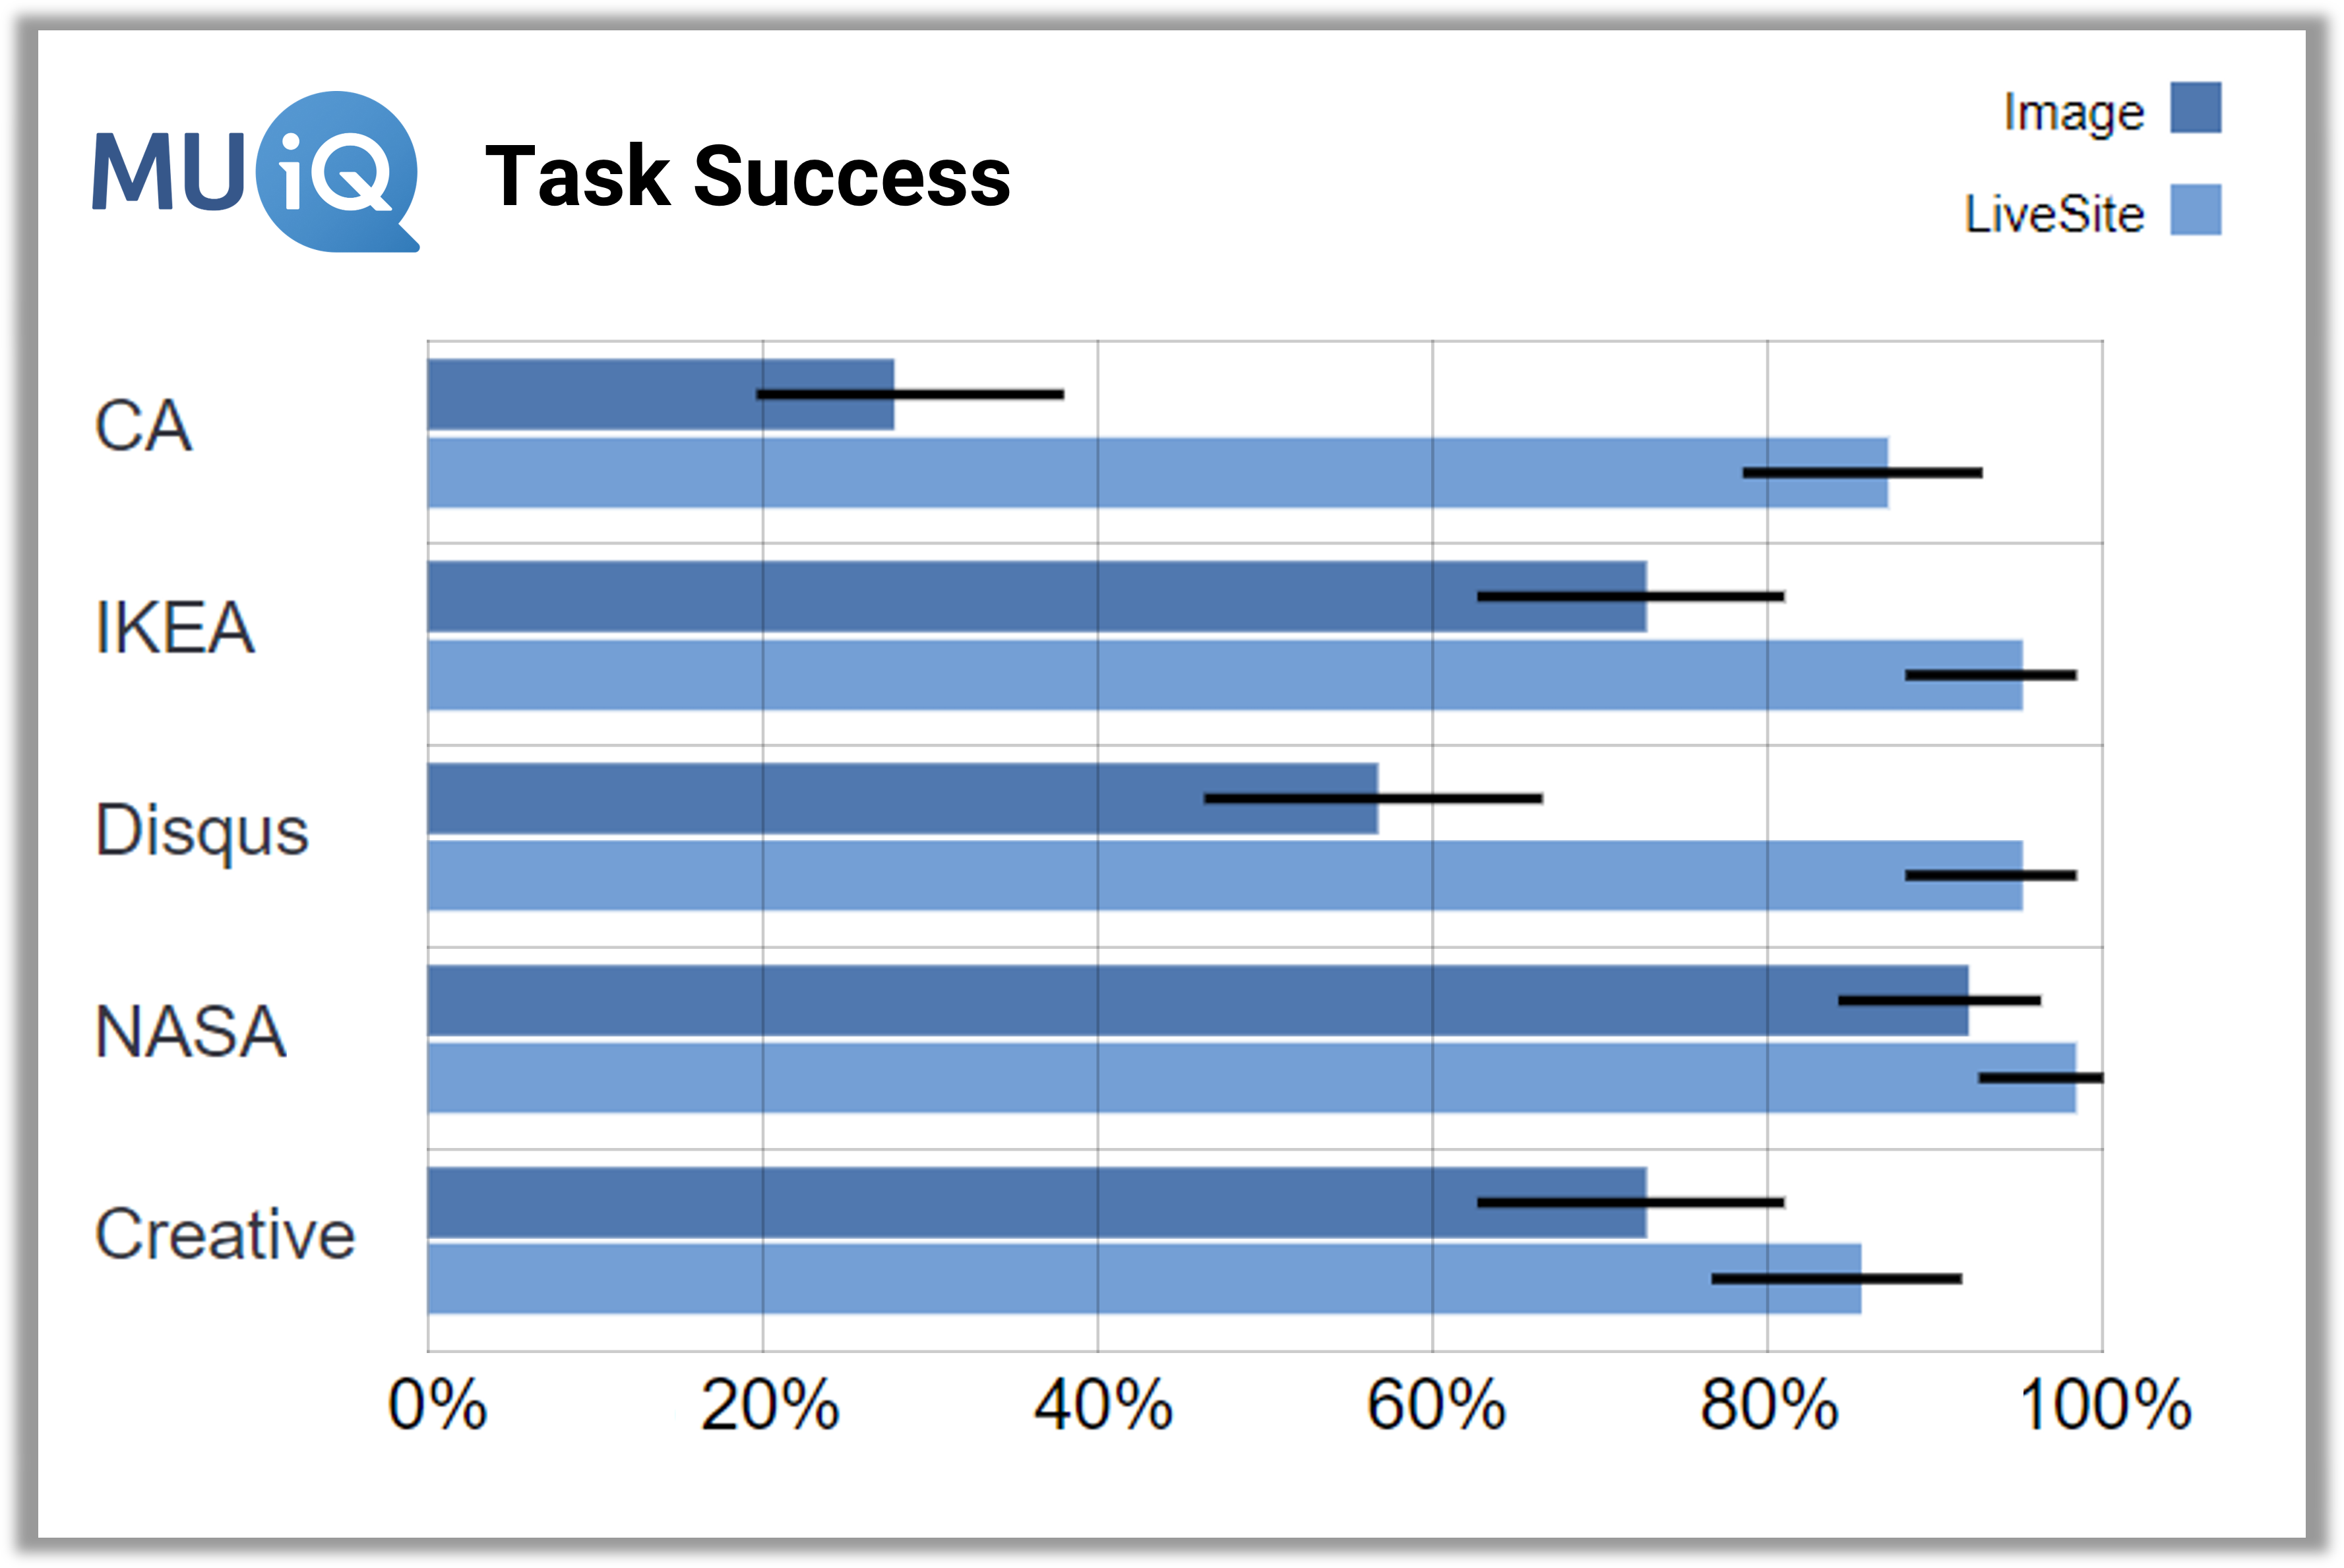
Figure 3: Task success rates (90% confidence intervals computed in the MUiQ platform).
Efficiency Measures: Time
When measuring efficiency in click, tests use time (measured in seconds and milliseconds). Examples of research questions include:
- How long does it take for people to make an initial selection (first click)?
- How much time do people typically take to complete a task with a UI design?
How to Analyze
When you analyze time data, you should use log-transformed t-confidence intervals, which can be done using our online calculator, or they are automatically computed in the MUiQ platform.
Online calculator. Figure 4 shows a 90% confidence interval from our online calculator, displaying task-completion times for the image of the Creative Commons homepage. The calculator shows three measures of central tendency: arithmetic mean, median, and our preferred estimate, the geometric mean. The geometric mean was 23.1 seconds with a 90% confidence interval ranging from 20.0 to 26.6. This online calculator always computes the confidence interval around the geometric mean rather than the median. Our research has shown that the geometric mean is more accurate when n < 25, and it’s about as good as the median when sample sizes are larger.
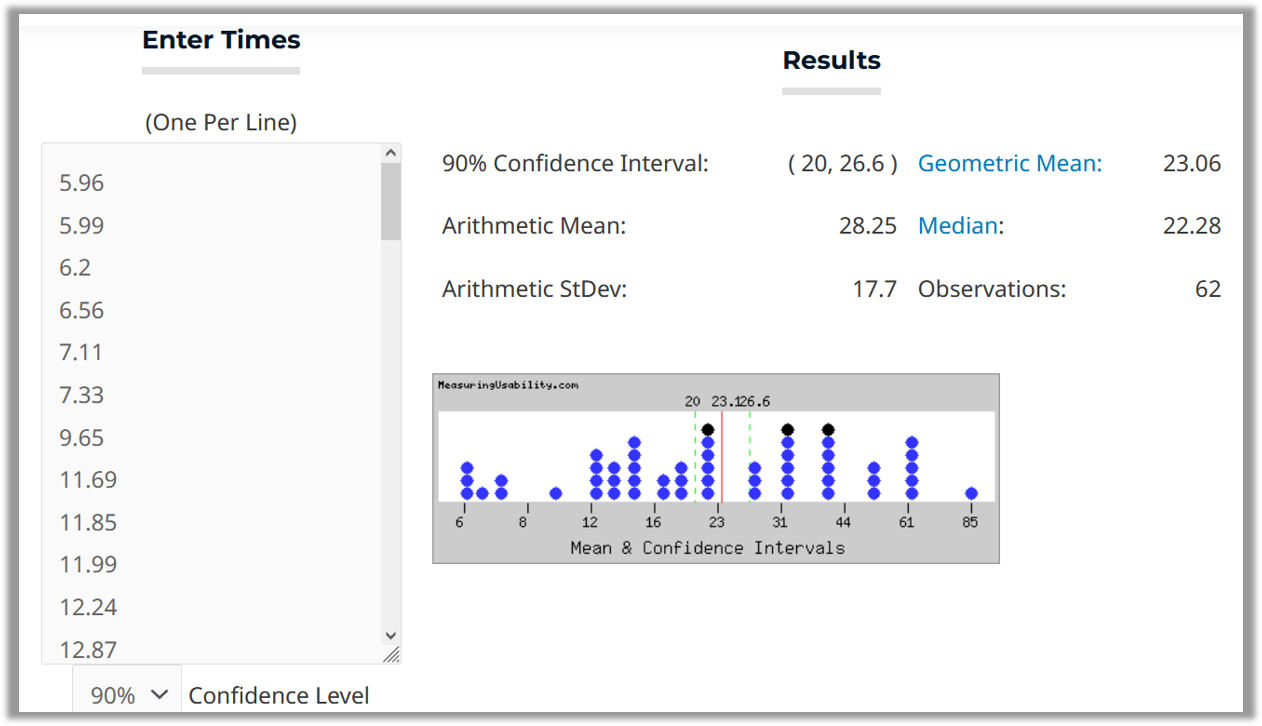
Figure 4: Time to task completion for Creative Commons (90% confidence interval around the geometric mean).
MUiQ platform. Figure 5 shows the completion times and 90% confidence intervals computed in the MUiQ platform. The slight difference in the confidence interval for the Creative Commons image is due to presenting the confidence interval around the median rather than the geometric mean. (MUiQ computes confidence intervals around the median when n > 25 and around the geometric mean when n < 25.)
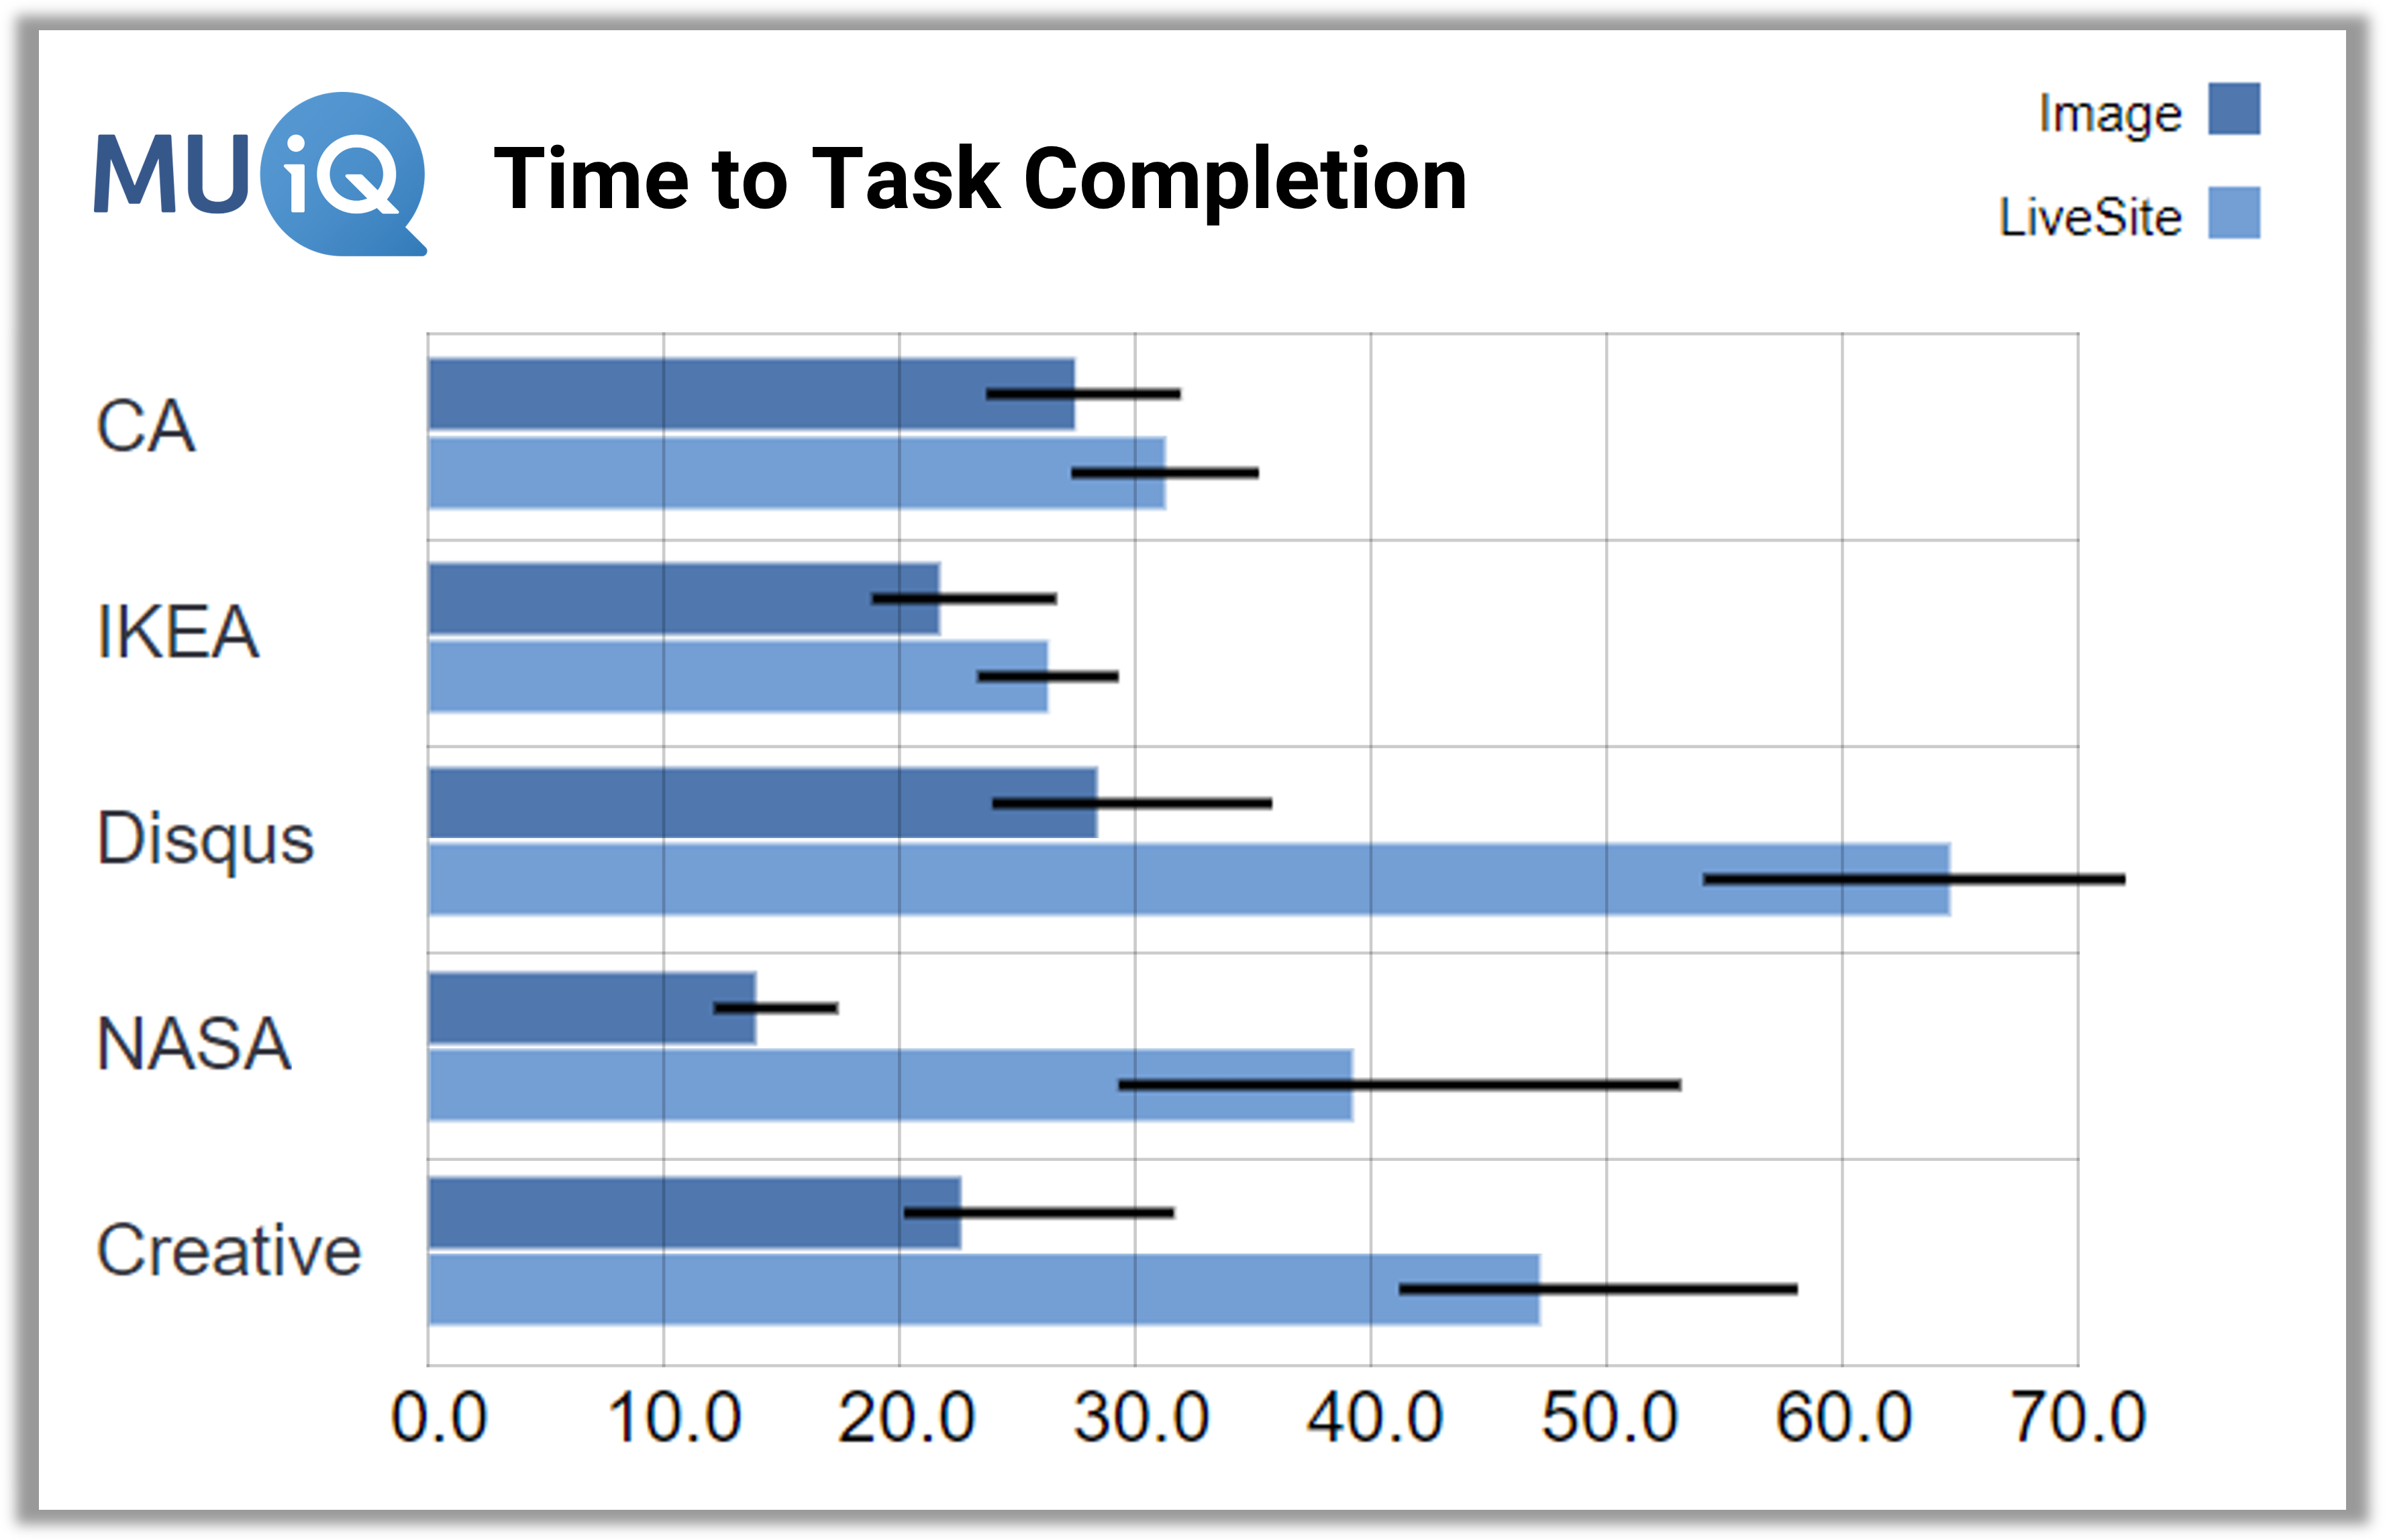
Figure 5: Time to task completion (90% confidence intervals around the median).
Efficiency Measures: Clicks
We generally recommend time rather than clicks to measure efficiency, but clicks can complement time. Research questions that involve clicks may include:
- What is the average number of clicks people make to find a correct link?
- How many times do people click to make their selections?
How to Analyze
To analyze clicks, we recommend using t-confidence intervals, which can be computed in our online calculator or automatically in the MUiQ platform.
Online calculator. With a sample size of 62, the mean number of clicks to task completion for the Disqus image was 1.4 with a standard deviation of 1.9. The 90% confidence interval around the mean ranged from 0.997 to 1.803 (Figure 6).
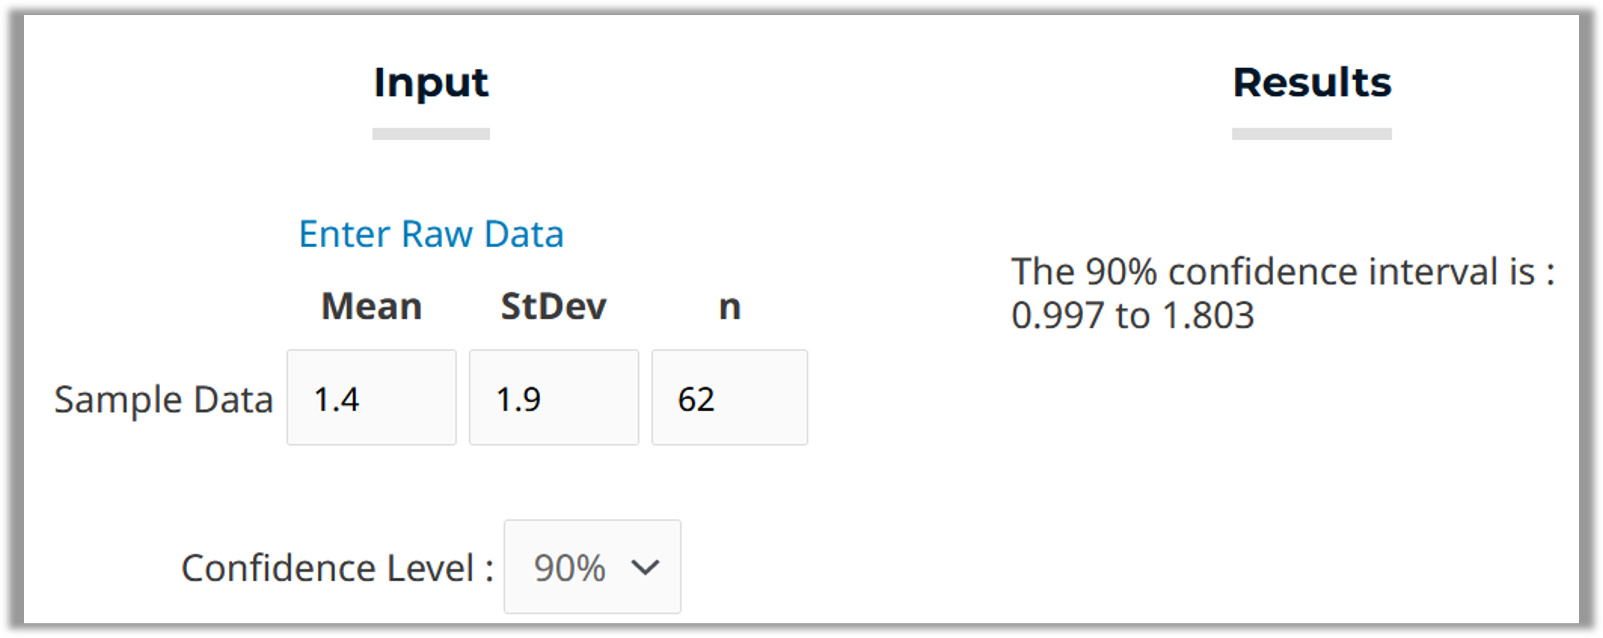
Figure 6: 90% confidence interval for the mean number of clicks to task completion on the Disqus image.
MUiQ platform. Figure 7 shows 90% confidence intervals for all websites and conditions around the mean number of clicks to task completion. At a glance, it’s apparent that except for IKEA, task completion on images took fewer clicks than on live websites.
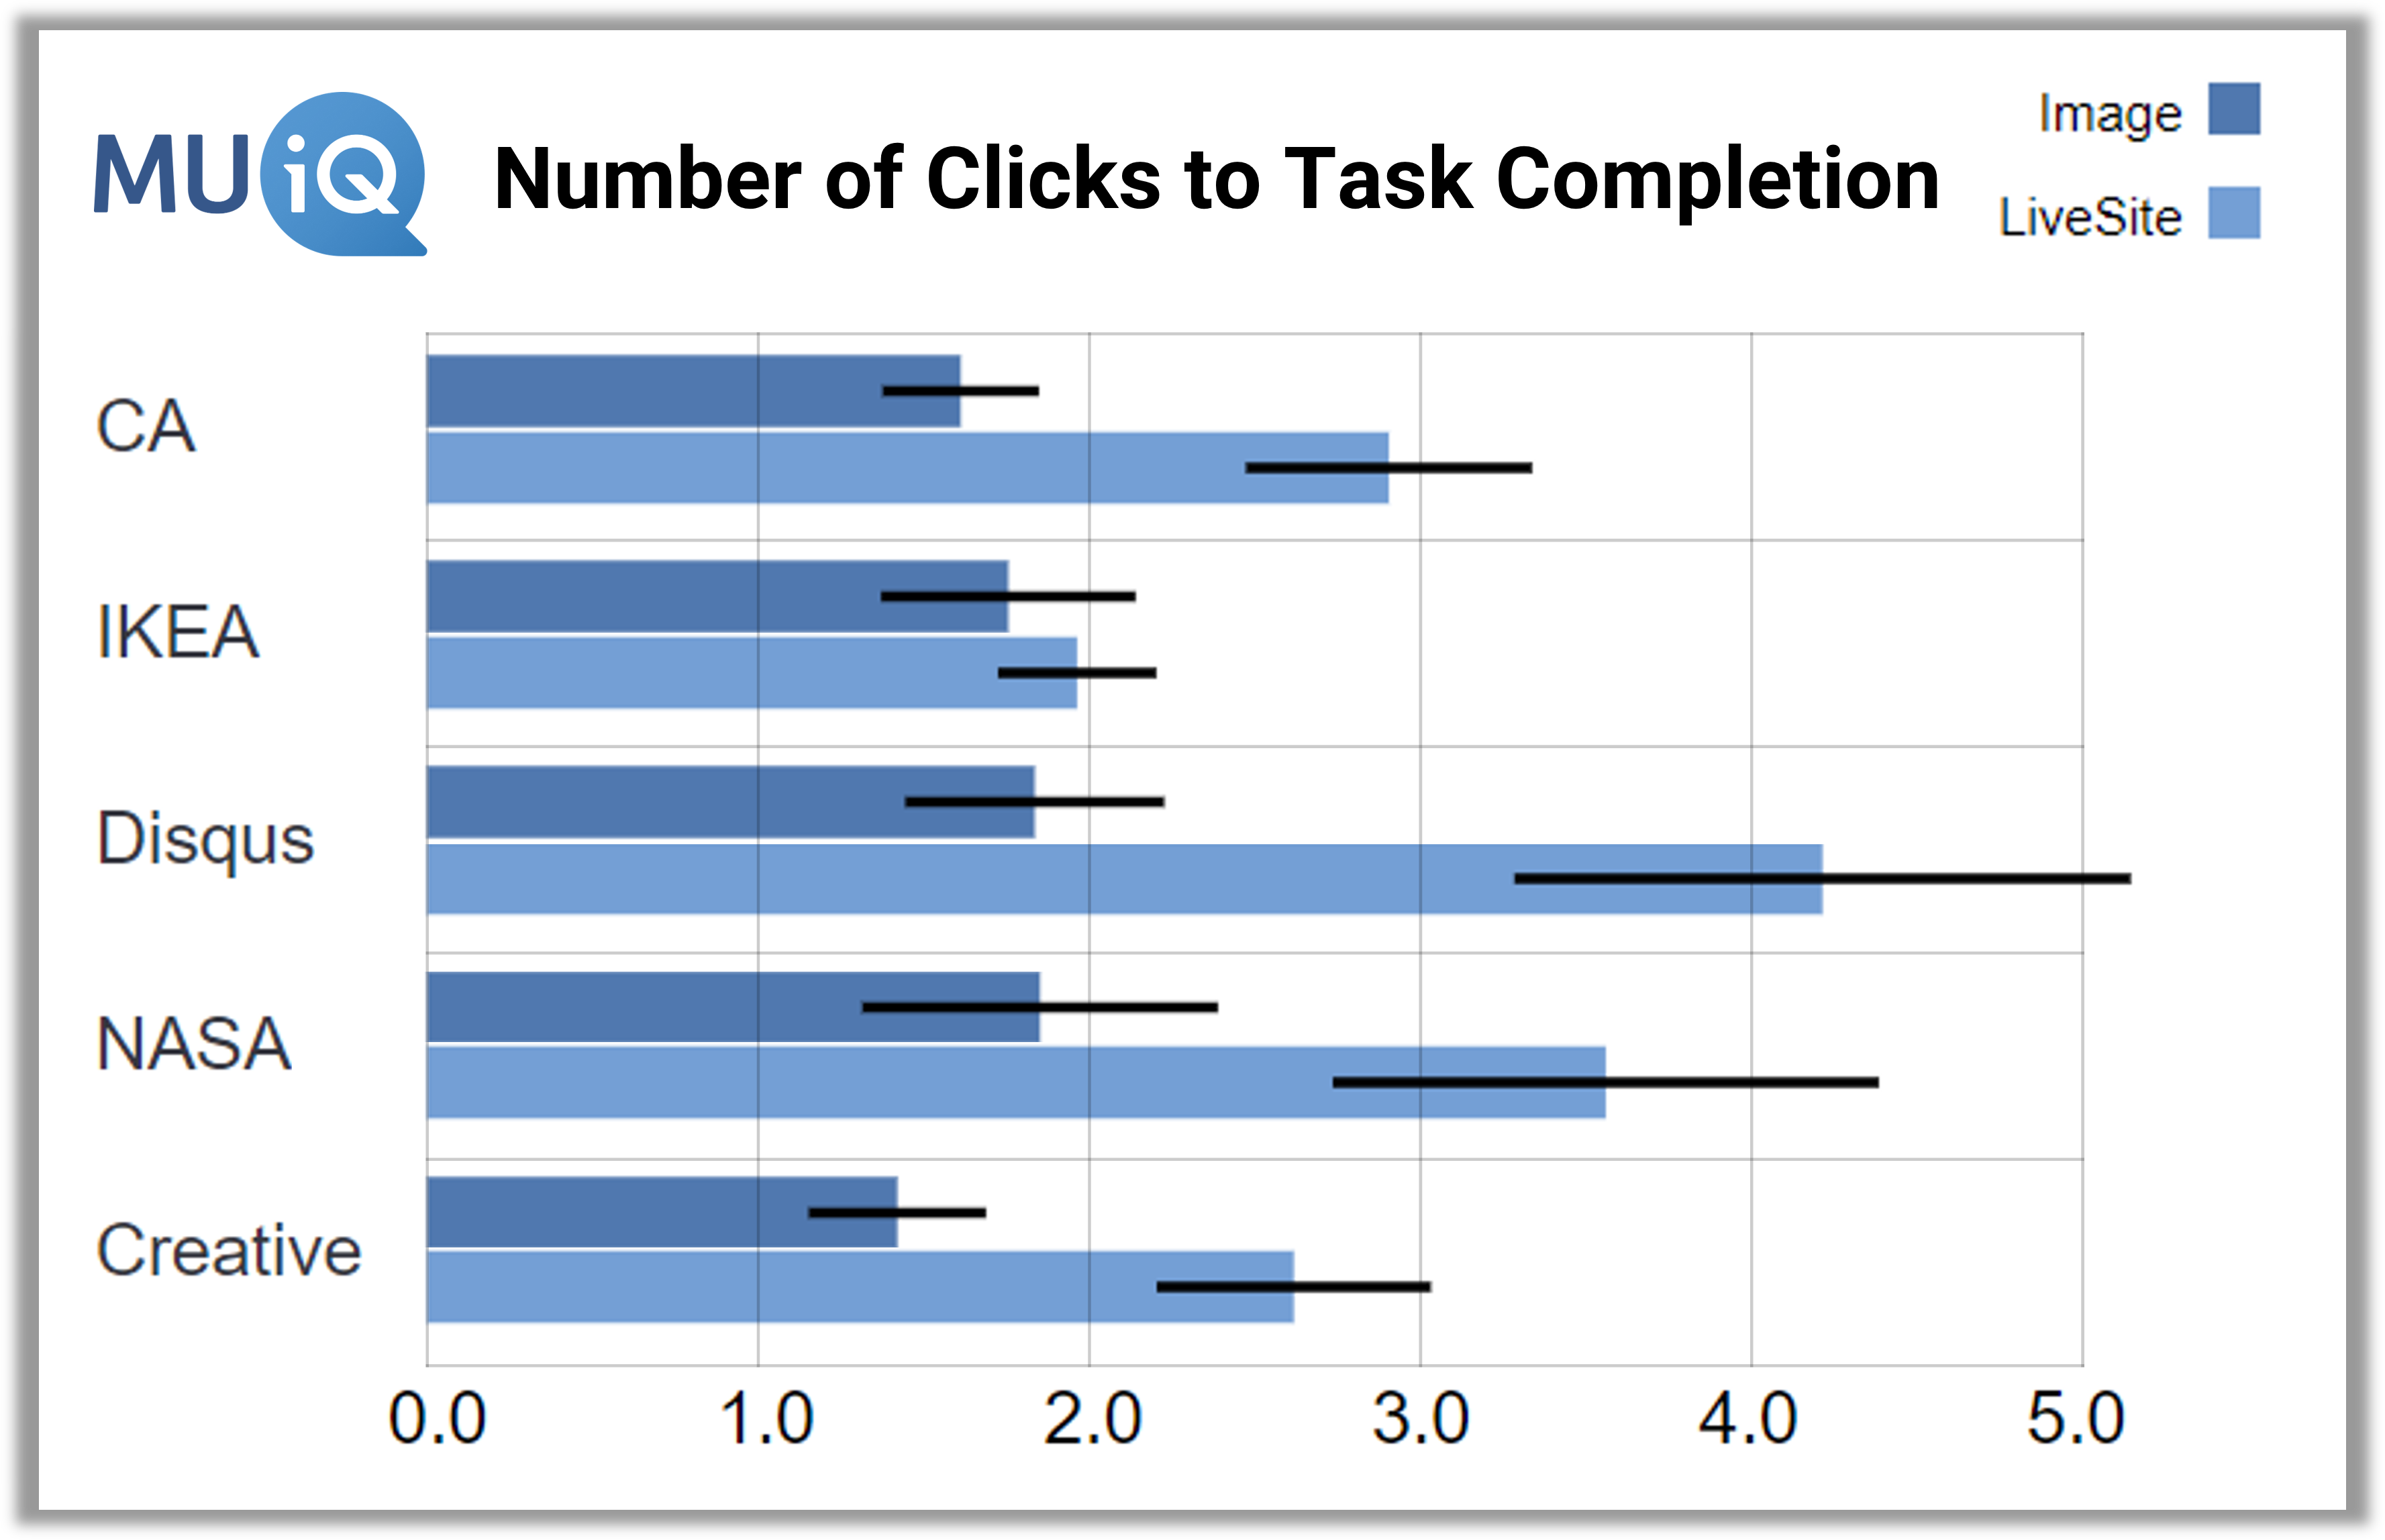
Figure 7: 90% confidence intervals around mean clicks to task completion computed in MUiQ for all five websites and both conditions (image and live).
Perception Measures: Rating Scales (e.g., SEQ)
Examples of research questions assessing the perception of the experience include:
- How difficult did participants think it was to locate a function?
- Is it easy for people to click on the correct location?
- How confident are participants that they clicked the right location?
How to Analyze
When you analyze rating scale data, you can compute the mean (the average), top-box responses (extreme responders), or both.
Analyzing The Mean
You can compute confidence intervals around the mean with t-confidence intervals using our online calculator or the MUiQ platform.
Online calculator. With the same calculator we used to analyze clicks, the 90% confidence interval around the mean SEQ of 5.18 with a standard deviation of 1.71 and sample size of 62 ranges from 4.817 to 5.543 for IKEA in the image condition (Figure 8).
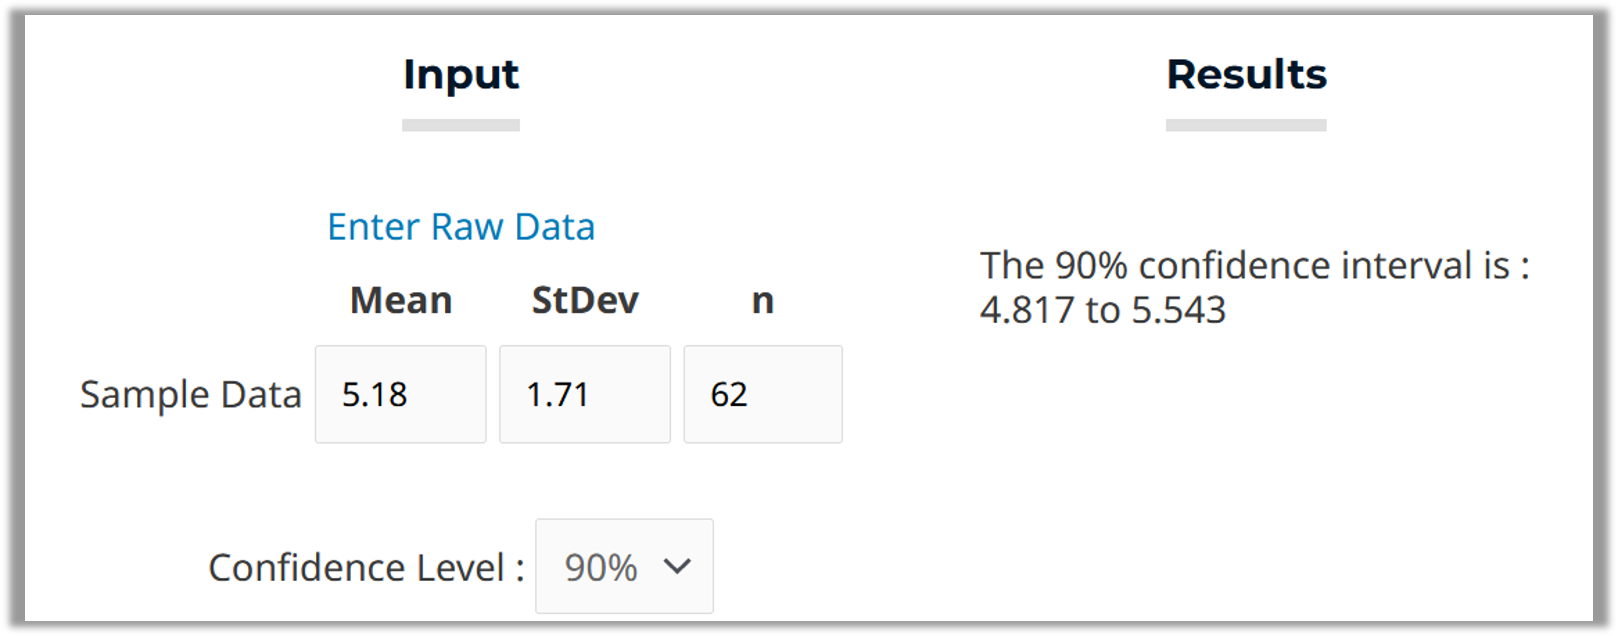
Figure 8: 90% confidence interval around the mean SEQ for the IKEA image (with summary data input).
MUiQ platform. Figure 9 shows, for all websites and conditions, the 90% confidence intervals computed around the mean SEQ in the MUiQ platform.
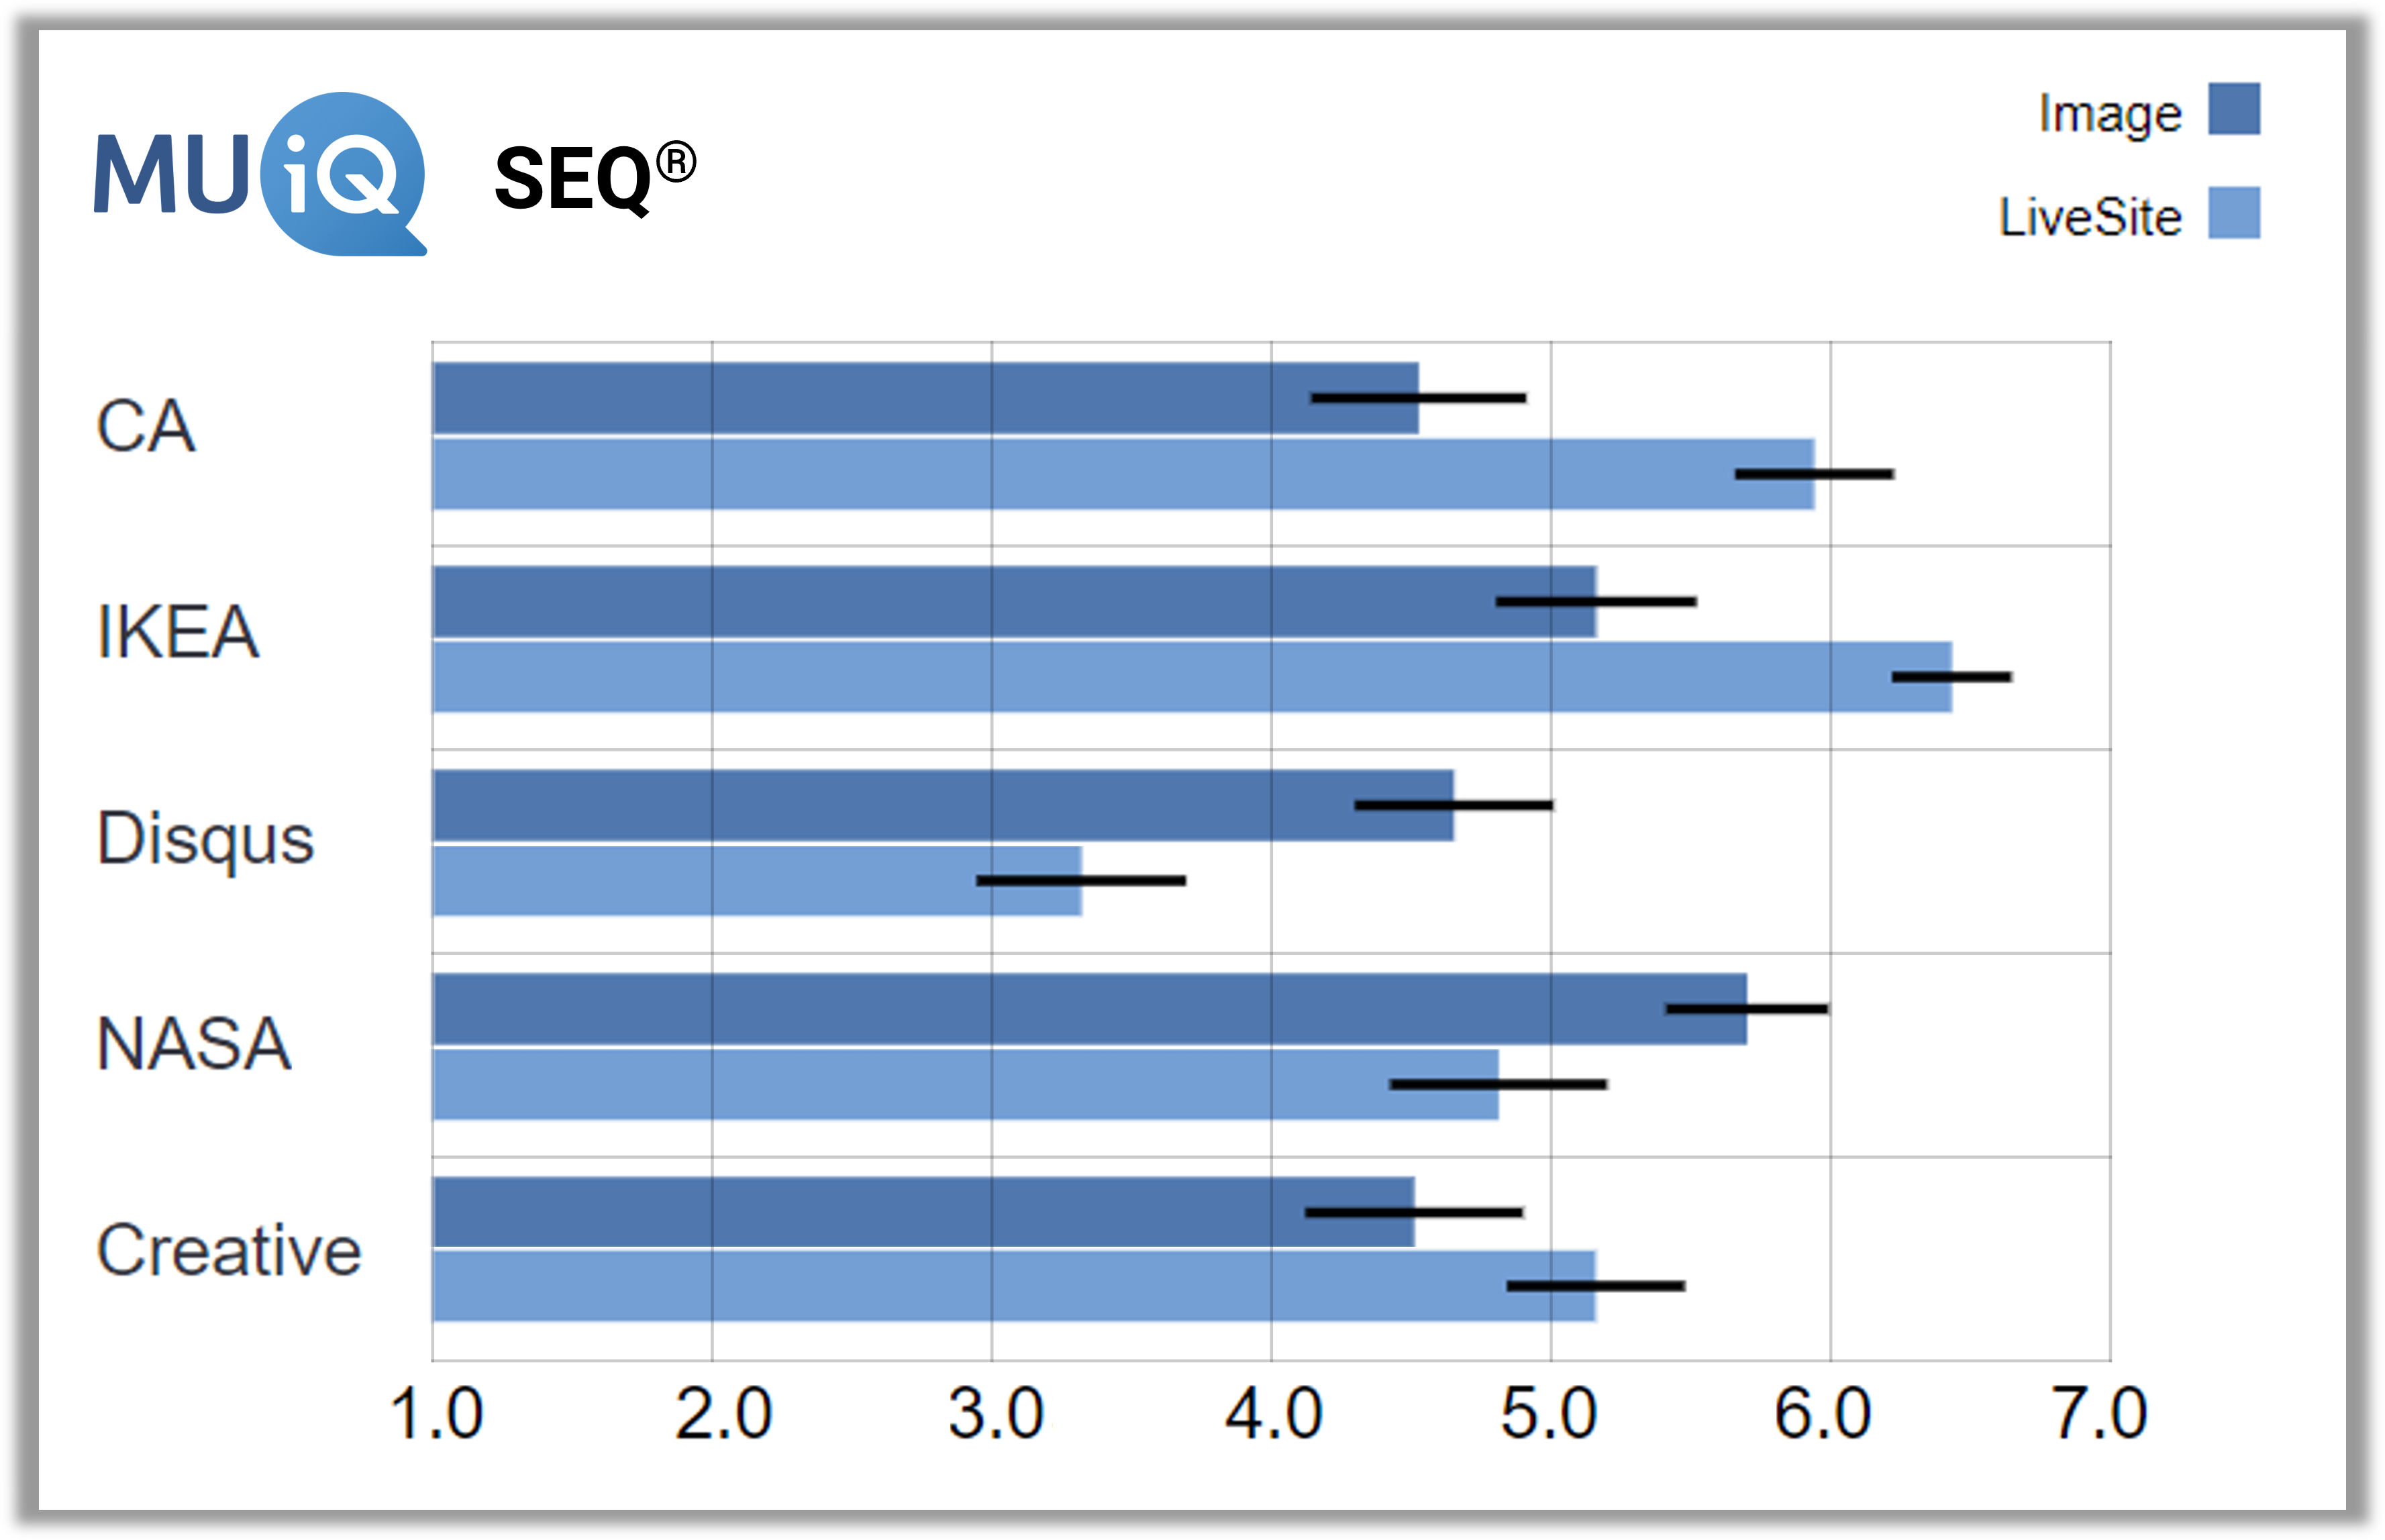
Figure 9: Mean SEQ ratings with 90% confidence intervals computed in MUiQ for all five websites and both conditions (image and live).
Analyzing Top-Box Scores
Box scores are percentages based on the frequency distributions of responses to rating scales. There are different types of box score, including top box, top-two box, bottom box, and net box. The top-box score is the percentage of most favorable responses (e.g., for the SEQ, the percentage of 7s). Like other percentages, we recommend computing adjusted-Wald binomial confidence intervals with our online calculator for binomial confidence intervals.
For the 62 participants who attempted the IKEA task in the click test study we ran, 15 selected the response option of 7 for the SEQ, so the top-box score was 24.2% with a 90% confidence interval ranging from 16.4 to 34.2% (Figure 10).
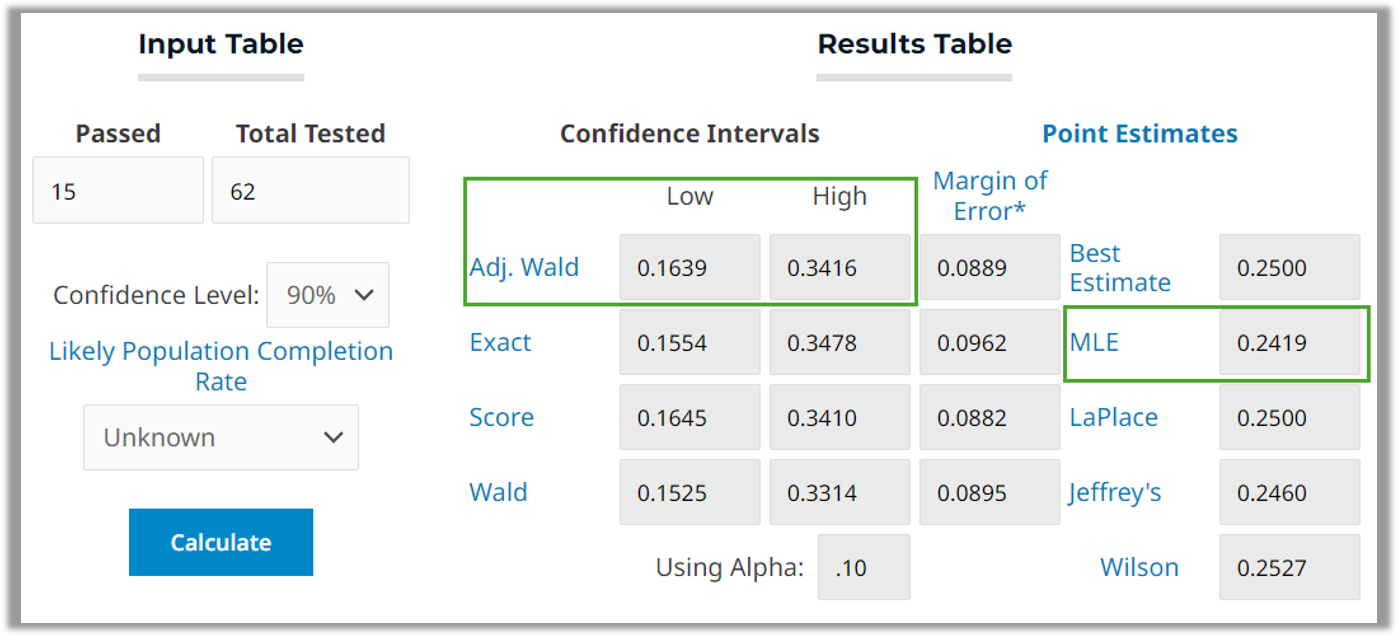
Figure 10: 90% confidence interval for the top-box score of SEQ ratings for the IKEA task in the image condition.
Summary
The key points from this discussion of analysis of click test metrics in stand-alone studies are:
- Click testing is a specialized type of usability testing that can produce numerous metrics that can be classified as measures of effectiveness, efficiency, and perception/satisfaction.
- Start with your research question (e.g., “How many people have a successful first click?”) and operationalize it into a percentage or mean.
- Compute a confidence interval around the percentage or mean. The confidence interval provides the best estimate of what the percentage or mean would be if you could somehow measure all your users.
- For percentages, compute the adjusted-Wald binomial confidence intervals.
- For means, use the t-confidence interval (for time data, use a log transformation).
- An advantage of using the MUiQ platform for click testing is the automatic generation of appropriate confidence intervals for many research questions.


