 How predictive are click tests? Does the first click on an image really predict what would happen on a fully functioning website?
In an earlier article, we reviewed the literature on click testing. We found that the primary—probably only—source that established the link between the first click and ultimate task success wasn’t done on images but on live websites.
In that same article, we studied five homepages and found generally good corroboration between images and live websites. Across hotspot regions, the average absolute difference in first-click behavior was only about 6%. Of the 28 regions, six had statistically significant differences in the percentage of first clicks, but some differences were as large as 20–40%. The main driver of the differences was due to interactive elements on websites that weren’t present in static images.
But in that study, we specifically picked homepages of websites that were relatively static and had few interactive elements, making tracking clicks easier. That suggests the 6% difference is a sort of best-case scenario. What happens when we compare more functionally rich internal pages featuring interactive filters with static images? Do we see similar results to our homepage study?
To find out we conducted another click test live site comparison study.
Study Details
In January 2023, we recruited participants from a US-based online panel to participate in the study. Participants were randomly assigned to one of six conditions: one of three websites (Lenovo, HP, or Dell) and either the live website or an image of the live website.
Participants in all conditions were asked to complete the same task to find a laptop. We wanted to limit participants from searching on the live website condition, so we asked them not to use search.
Task Descriptions
- Live Site: Let’s imagine you’re looking to purchase a new laptop computer. Using the following webpage, demonstrate how you would find a laptop computer that has a 15″ screen size and is under $1000. Please do not use the search bar for any part of the task.
- Image: Let’s imagine you’re looking to purchase a new laptop computer. Where would you click to find a laptop computer that has a 15″ screen size and is under $1000?
Note that in our earlier study, the main first-click comparisons were between-subjects (image or live site), but participants attempted tasks on five websites or images (a within-subjects component). We made the current study fully between-subjects to prevent any potential carry-over effects from a task that was the same on all websites. Doing so reduces the power of statistical tests, so we tripled the sample size to help offset that power reduction.
Study Results
After removing those who dropped out, we had data from 306 participants (Table 1).
| Condition | Median Study Time (complete) | Dropout % | Final Sample |
|---|---|---|---|
| Dell Image | 195 | 2% | 49 |
| Dell Live | 204 | 2% | 52 |
| HP Image | 186 | 2% | 52 |
| HP Live | 207 | 6% | 51 |
| Lenovo Image | 163 | 2% | 51 |
| Lenovo Live | 224 | 4% | 51 |
Participants assigned to a live website condition spent about 11% longer attempting the task but had a comparable dropout rate (Table 2).
| Condition | Median Study Time (complete) | Dropout % |
|---|---|---|
| Image | 186 | 2% |
| Live | 207 | 4% |
We identified similar hotspot regions on the image and live conditions. We focused on seven hotspots defined on each of the the three websites, for a total of 21 hotspot regions in these analyses. As we did in our earlier analysis, we focused on the first click of each participant as our primary dependent variable.
The 21 hotspot regions accounted for an average of 97% of the first clicks on the live websites and 91% of the first clicks on the images. The other clicks were distributed across the websites or images in other places (e.g., footers or links throughout the page).
As shown in Table 3, 6 of the 21 regions had statistically significant differences (p < .10). The average absolute difference between the percentage of first clicks in a region was 8%, with the maximum difference of 31% on the Lenovo website. None of the Dell differences were statistically significant.
| Site | Element | Live % | Image % | Abs % Diff |
|---|---|---|---|---|
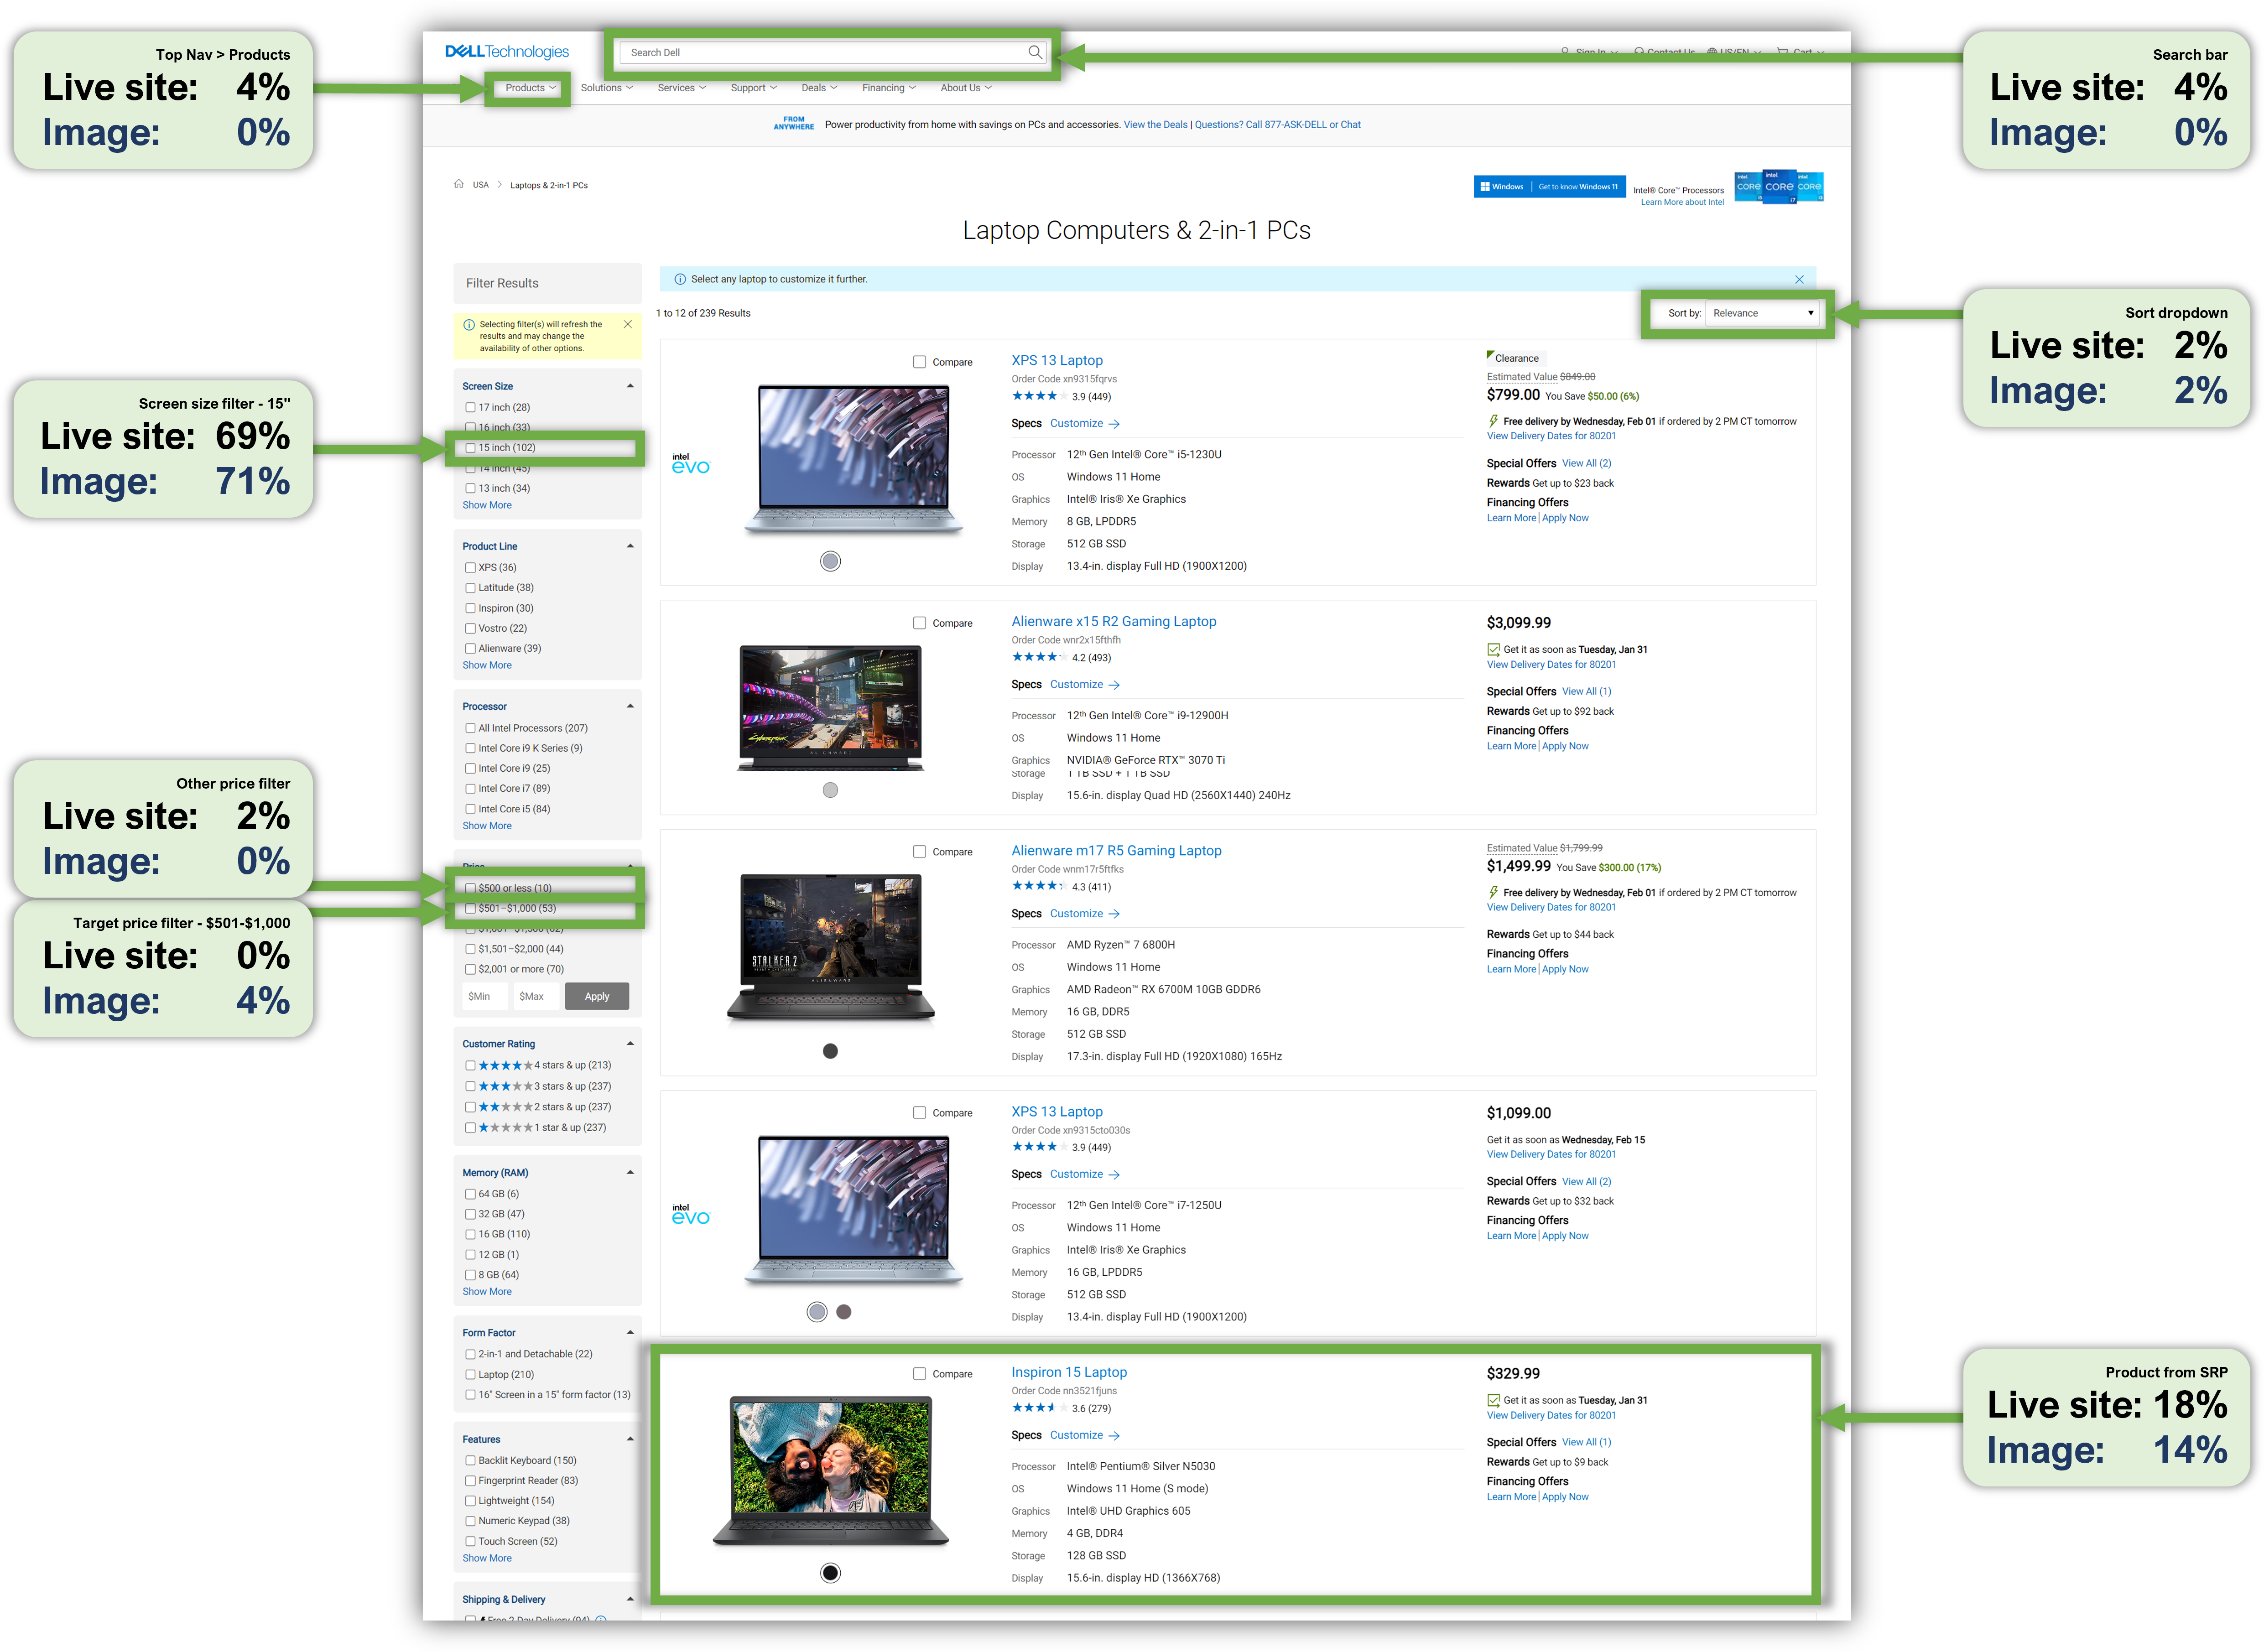
| Dell | Screen size filter: 15" | 69% | 71% | 2% |
| Dell | Price filter: $501–$1,000 | 0% | 4% | 4% |
| Dell | Product on SRP | 18% | 14% | 4% |
| Dell | Top Nav > Products | 4% | 0% | 4% |
| Dell | Sort dropdown | 2% | 2% | 0% |
| Dell | Other price filters | 2% | 0% | 2% |
| Dell | Search bar | 4% | 0% | 4% |
| Dell | Total | 100% | 92% | |
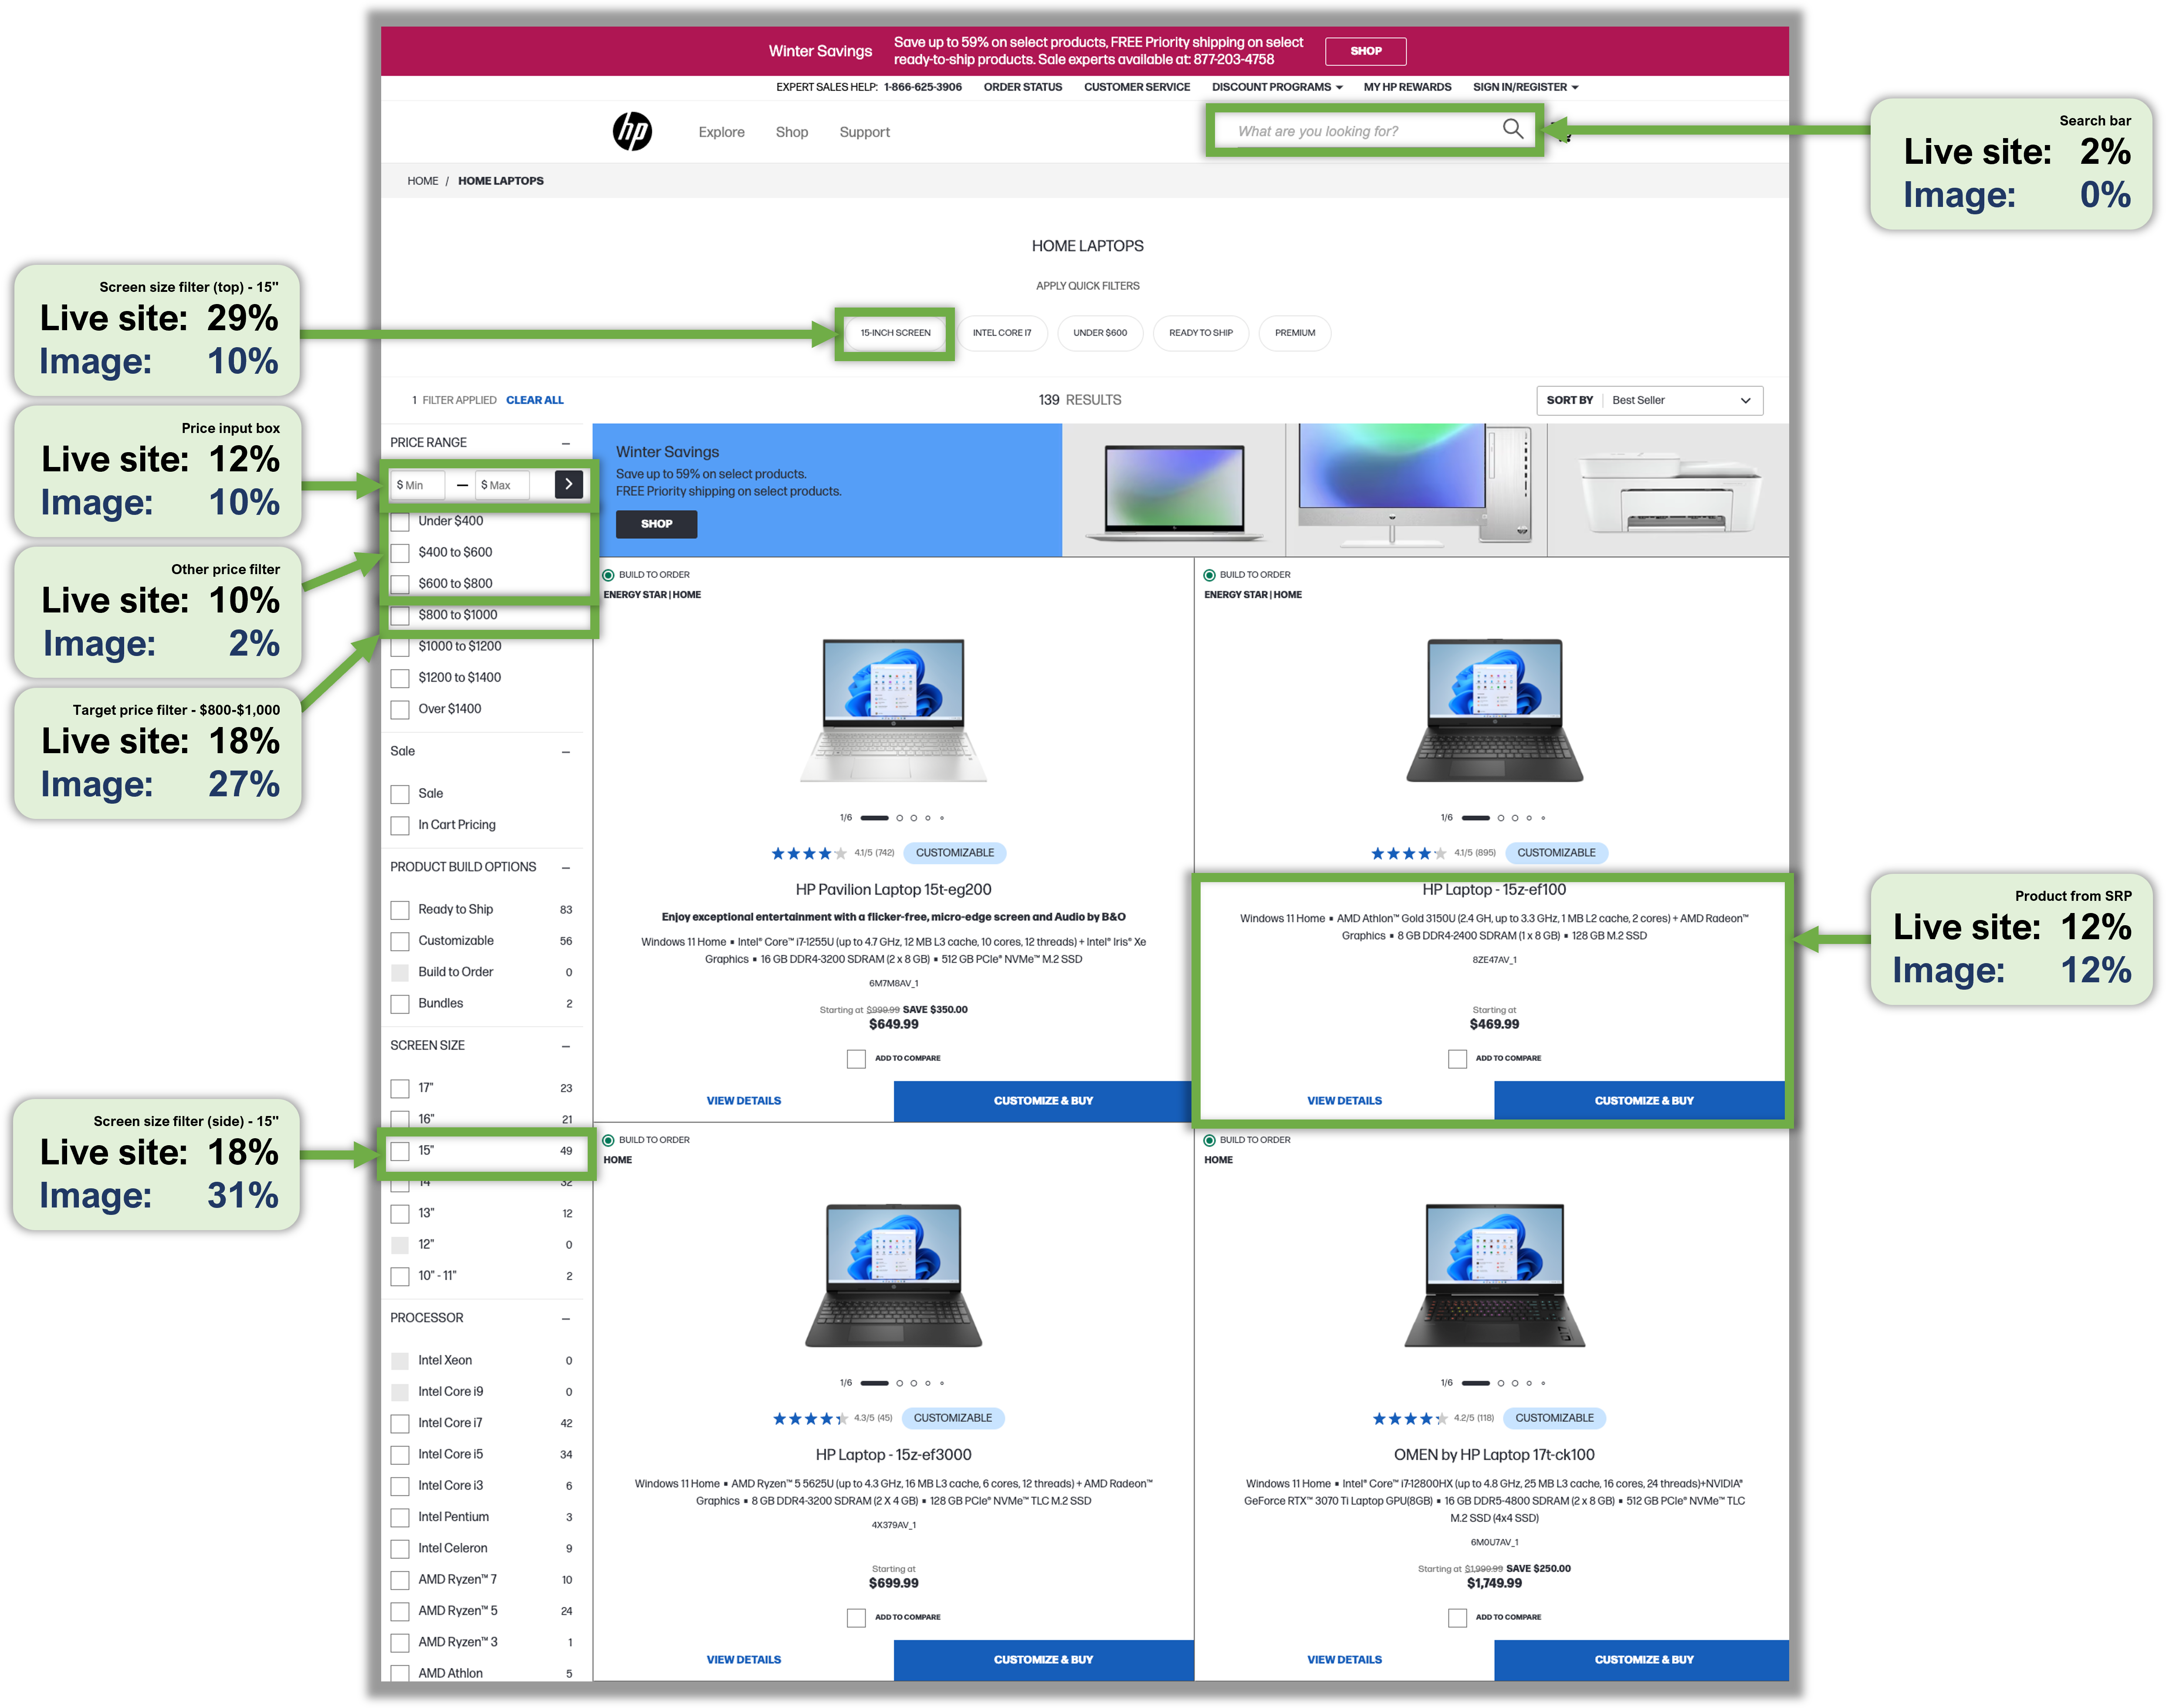
| HP | Screen size filter (top): 15" | 29% | 10% | 20% |
| HP | Screen size filter (side): 15" | 18% | 31% | 13% |
| HP | Price filter: $800–$1,000 | 18% | 27% | 9% |
| HP | Price input box | 12% | 10% | 2% |
| HP | Product on SRP | 12% | 12% | 0% |
| HP | Other price filters | 10% | 2% | 8% |
| HP | Search bar | 2% | 0% | 2% |
| HP | Total | 100% | 90% | |
| Lenovo | Screen size filter: 15"–16.9" | 25% | 57% | 31% |
| Lenovo | Product on SRP | 18% | 31% | 14% |
| Lenovo | Price filter: $800–$999.99 | 24% | 0% | 24% |
| Lenovo | Sort dropdown | 8% | 0% | 8% |
| Lenovo | Top Nav > Laptops | 8% | 2% | 6% |
| Lenovo | Other price filters | 10% | 0% | 10% |
| Lenovo | Search bar | 0% | 0% | 0% |
| Lenovo | Total | 92% | 90% |
We overlaid the percentage of first clicks from participants in both image and live site conditions for selected hotspot regions in Figures 1 through 3.
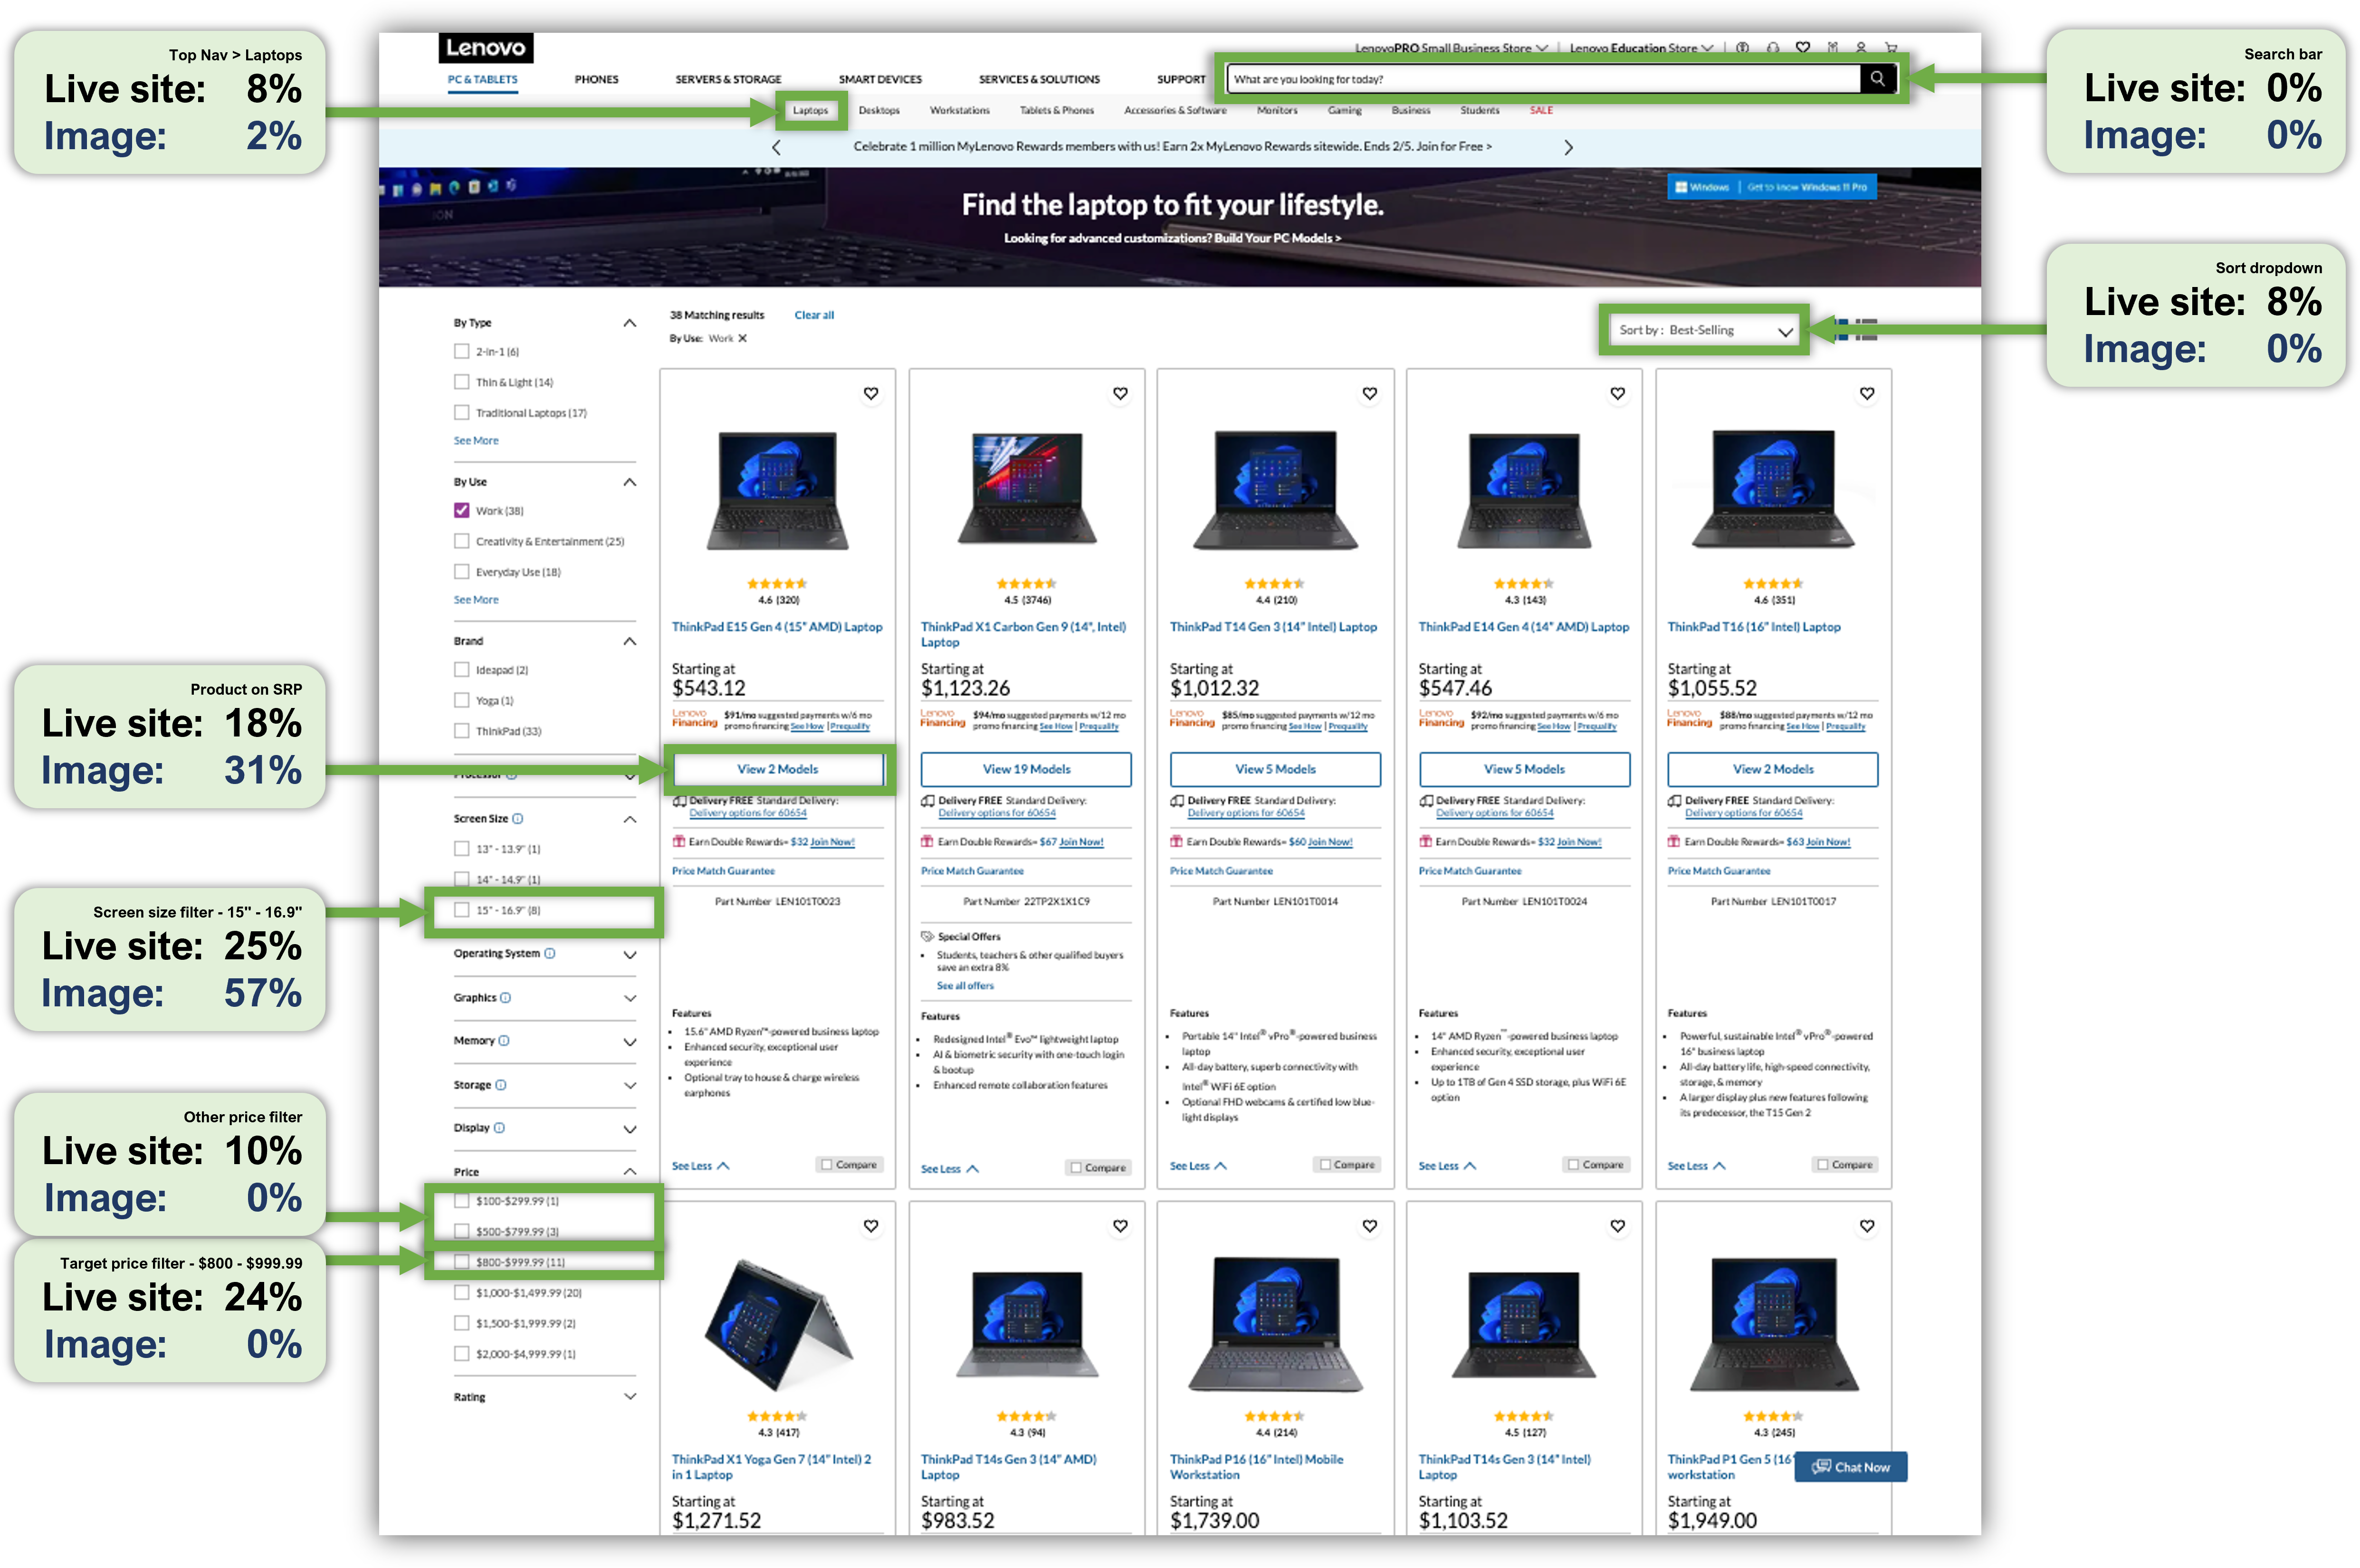
Like the homepage study, we also encountered problems in keeping the stimuli consistent. Most notably on the Lenovo website, the number and location of the filters varied on the website for participants based on their inventory. Participants in the image condition always saw the price and screen size filters in the same locations.
Reasons for Significant First-Click Differences
There were no significant differences for Dell, and with one exception, all statistically significant differences were related to screen size and price filters. As best as we could, we hypothesized possible reasons for the discrepancies in participants’ first clicks between image and live site conditions for the six areas with statistically significant differences. In general, we suspect that most of these significant deviations in click patterns were due to dynamic elements on the live site and participants’ knowledge of whether they were clicking on a live site or an image. Across all three websites, participants in the image condition were significantly more likely to put their first click on one of the relevant side filters (display size or price) than those in the live condition (70% image versus 60% live, (N−1 χ2(1) = 3.4, p = .07).
HP
The two significant differences for HP were for the screen size filter at the top of the page and the other price filter. In both cases, participants in the live condition were more likely to click first on these filters than participants in the image condition.
HP screen size filters (top and side)
In addition to standard filters along the left side of the page, HP has a set of “quick filters” toward the top of the page, including one for 15” screens. The top filter was clicked first about three times more by live site users than those who saw an image of the page (29% versus 10%, p = .012). This was balanced somewhat by the percentage of participants who selected the same value from a set of filters on the left side of the page (18% live vs. 31% image, p = .122). Combined, the first-click percentage on one screen size filter or the other was 47% for the live condition and 41% for the image condition, but the difference in these click patterns was statistically significant (N-1 χ2(1) = 6.6, p = .01), with more live selection of the top filter but more image selection of the side filter.
We don’t have definitive data to determine why this happened. Because it’s become somewhat standard to put filters on the left side of a product page, we generally expect users who plan to use filters to scan the left side of the page from top to bottom, searching for the filters they need. There was a difference in the size of the stimuli in the live and image conditions (slightly smaller for the image), so that might have had some differential effects on the saliency of the top filter.
HP price filters (target and other)
We defined two hotspots for choices in the price filters—one for the filter that included $999.99 (to match the task instruction that the target price should be below $1000) and one for all other filters that were less than $1000 (also legitimate choices for the first click). About five times more live than image participants placed first clicks on one of these “other price” filters (10% vs. 2%, p = .09). This was balanced by the percentage of participants who selected the filter that included the price specified in the task description (18% live vs. 27% image, p = .26). The combined first-click percentages of target and other price filters were 28% for the live condition and 29% for the image condition, but the difference in these click patterns was statistically significant (N−1 χ2(1) = 3.6, p = .06).
We’re not sure why participants in the image condition started with the target option rather than starting at the top of the list of applicable price ranges and working their way down to the option containing $999.99.
Lenovo
One of the four significant differences for Lenovo was associated with the screen filter, two with price filters, and one for the sort dropdown toward the top of the page.
Lenovo screen size filter
More than twice as many first clicks in the image condition relative to the live condition were on the screen size filter (57% vs. 25%, p = .001). This filter was the first click for more than half of the participants in the image condition, but only a quarter of the participants in the live condition. Apparently, participants in the live condition were more likely to deviate from selecting the first relevant choice in a top-down scan of the Lenovo page.
Lenovo price filters (target and other)
None of the participants in the image condition placed a first click on any of the price filters, target or other, in contrast to those in the live condition, 24% of whom put first clicks on the target price filter (p < .0001) and 10% of whom clicked on one of the other price filters (p = .02). This click pattern was different from the HP condition, most likely due to the order in which the filters appeared on the HP and Lenovo pages (HP displays price filters above size filters; Lenovo displays size filters above price filters). This suggests a tendency for participants in the image condition to be more likely than those in the live condition to scan the typical filter location from top to bottom, putting their first click on the first relevant filter they encounter (display size or price).
Sort dropdown
Participants in the Lenovo live website condition were statistically more likely to use the sort dropdown box compared to those in the image condition (8% vs. 0%). No image condition participants clicked on the Sort dropdown box first. We suspect this is a case of live site participants knowing the element would change the results whereas participants interacting with the image did not—a good example of how the stimuli can change first-click behavior when it isn’t possible to conduct a blinded experiment.
Summary and Discussion
Our analysis of the first clicks of 306 participants randomly assigned the same task with a live website or image of the same website found that
First clicks are generally similar between images and live websites. Across hotspot regions, the average absolute difference in first-clicking behavior was only about 8%. Six of the twenty-one regions had statistically significant differences in the percent of first clicks (no significant differences for Dell). The largest difference in first-click percentages between regions was 31%.
Differences in stimuli likely drive different clicking. Consistent with our findings in the homepage study, we found that differences in dynamic functionality (e.g., changing filters) drove different clicking behavior, primarily on the Lenovo website, which accounted for the bulk of the differences (two differences in first clicks greater than 20%). This suggests that if you are conducting a first-click test on a site with dynamic elements, your results from a first-click test on an image may not be as comparable.
The reasons for some differences are unknown. For several statistical differences, we just weren’t sure what was fundamentally driving the different first-click behavior. For example, across all three product pages, participants in the image condition were significantly more likely to place their first click on one of the relevant display or price filters on the side of the page, but we don’t really know why. There was also a puzzling difference in the click patterns for the HP price filters. A future study can investigate possible reasons for differences in click behavior by probing participants on their reasons for clicking.
Resolutions may play a role. A likely cause for some of the different first-click behavior on the filters could be different screen sizes and resolutions. Websites often shift their layout (responsive design) to account for different resolutions. The prominence of some elements will shift with differing resolutions and likely explain some of the behavior. This is an important caveat when using click testing. Because static images don’t respond, everyone has the same stimuli. This provides a more internally valid study (because the stimuli are controlled) but may reduce the external/ecological validity because participants will have varying display sizes.
Click testing is likely good enough. Despite the differences in stimuli from different screens and changing filters and inventory, many first-click regions had comparable percentages, and on average, the absolute difference was under 10%. This suggests click testing is an adequate method for understanding general areas where people will click first—just don’t expect precision to be better than ±10%.
We examined only the first click; more questions remain. Our first two studies have focused on just the first click behavior. But what about time, perceived ease, and total clicks? How do these metrics change when using images instead of live websites or on mobile? We’ll address these questions in future articles.