 Click testing is an efficient UX research method for understanding where people click on an image.
In an earlier article, we reviewed when and why to use a click test. It is often used in the design and release phases of product development, and it generates mostly quantitative data.
We also showed how click testing can approximate how people click on a live website (especially when the page doesn’t contain dynamic elements).
As part of our earlier validation study on home pages and product pages, we used several metrics to help understand the comparability between live sites and images.
Because click testing can be considered a specialized type of usability testing, click-testing metrics are largely defined by the ISO definition of usability as a combination of effectiveness, efficiency, and satisfaction. Click testing is a task-based method that generates a mix of action (what people do) and attitude (what people think) metrics, emphasizing the former.
While looking at click maps and heat maps can be insightful, you can take click testing to the next level by understanding and using these essential metrics.
Effectiveness Metrics
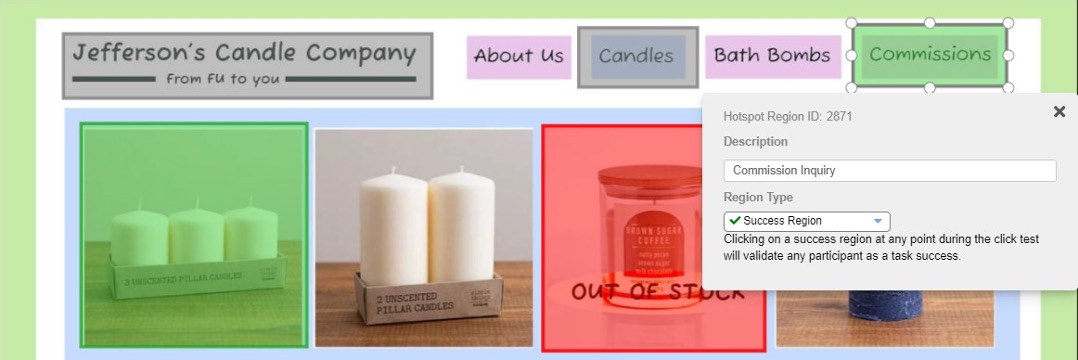
Designers and product teams want to know exactly where people click but may also want to track clicks within areas of interest (AOIs). AOIs can be buttons, menu items, or other functions designated as hotspots (Figure 1).
The number of participants clicking within an AOI can be converted to a percentage similar to a completion rate. Specific click locations and the number or percentage of clicks within AOIs become core click-testing measures of effectiveness.
Click Success/Failure
Certain hotspots/AOIs can be defined as part of an optimal “happy” path, generally considered “correct” in completing a task. Images can have multiple designated hotspot regions, as shown in Figure 2. If a participant clicks on a successful hotspot region, it’s coded as 1 for success; otherwise, the click is coded as 0 for failure (just like a standard completion rate in a usability test).
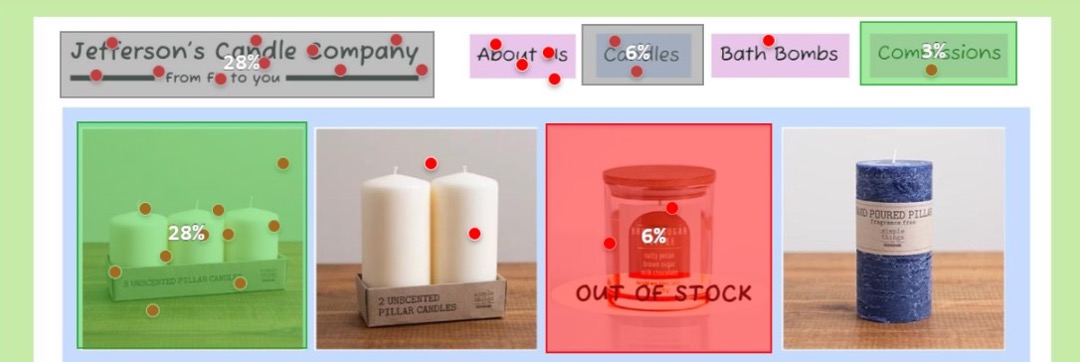
The inverse of success is failure, and sometimes showing task failure rates can be more influential than success rates. These percentages can be presented with confidence intervals and used in statistical testing, as shown in Figure 3.

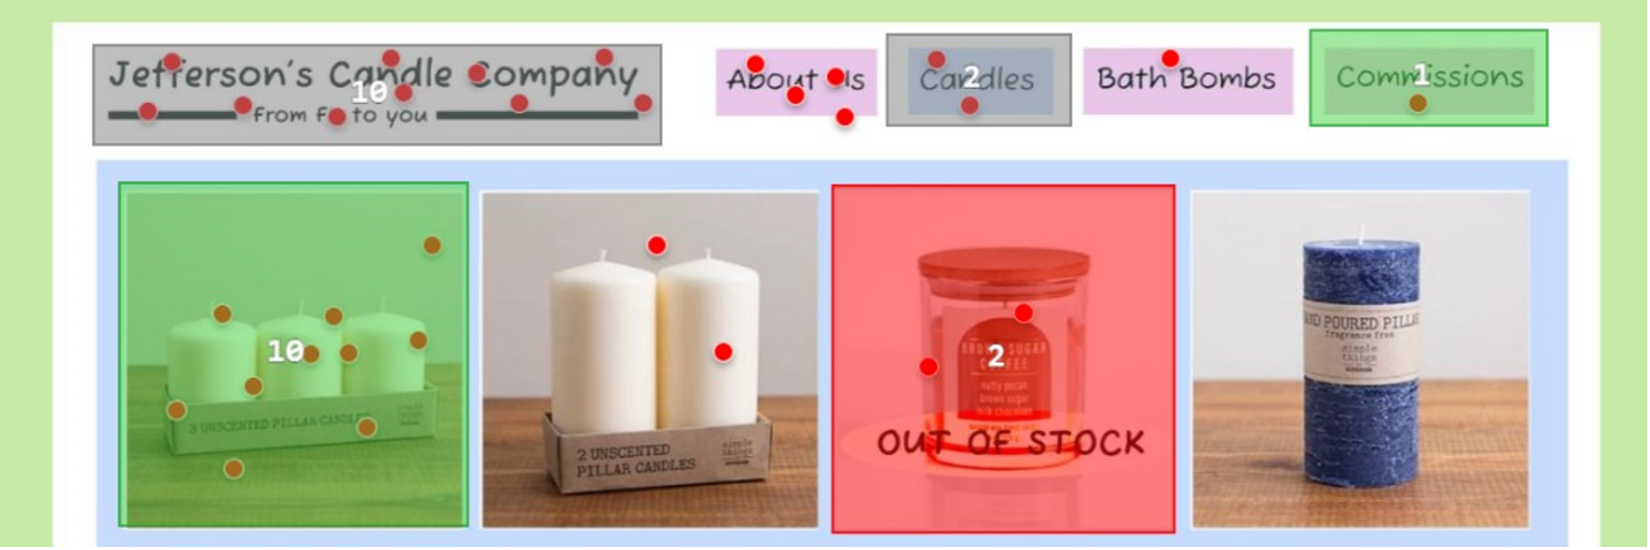
First Click Success/Failure
Some research suggests that the first click can predict ultimate task success (on a fully functional website or product). The first click then becomes a special type of success metric.
Clicks Below the “Fold”
We often run click tests on images of websites and generate hotspot areas of interest. But in addition to clicks within specified hotspots, knowing that a participant scrolls further down a page provides additional information (Figure 4). This can be especially helpful if the intended region is located near the top of the page and participants aren’t clicking on it. The term “fold” in this case comes from newspapers that needed to be folded to be displayed on newsstands. Only stories above the fold could be seen by a passerby. In its digital use, hotspots that can only be seen if participants scroll can be aggregated as clicks below the fold.

Efficiency Metrics
We’re not interested solely in if people can locate features or content; we also need to know how much effort it takes.
Time Till First Click
The quintessential efficiency measure is time. The first click generally happens within seconds or milliseconds (Figure 5). The nice thing about time is it’s relatively sensitive to subtle differences in visual displays in images and interfaces. Slight delays in decision making may indicate problems as people take longer to comprehend and potentially lead to incorrect decisions (task failures). For example, we’ve used the time to click in milliseconds to compare the effects of 3D graphs on selection time.

Total Time on Task
An extension of time till the first click is simply the average time participants spent on a click test task. This is treated the same as task time in a usability test as a measure of efficiency. We recommend log transforming the time to account for the positive skew (something done automatically in MUiQ).
Overall Number of Clicks
The average number of clicks on the entire image or concept provides a crude measure of engagement (Figure 6). This is likely more meaningful as a comparison measure. Are there more clicks on concepts A or B?
Perception (Satisfaction) Metrics
Asking participants immediately after a click test to reflect on their experience by responding to rating scales can provide insight into their attitudes toward the experience. Similar to usability testing, post-task attitudinal metrics tend to correlate highly with each other, so we usually ask only one rating scale question.
Ease of Finding/Clicking
Ask participants immediately after they attempt a click test how easy (or difficult) the task was using the Single Ease Question (SEQ®), like the one shown in Figure 7. The SEQ is efficient and as sensitive as multiple-item measures of perceived ease. Click-test studies will often involve multiple tasks, so keeping questions to a minimum allows for more time to collect the clicks. But as with usability testing, a task in a click test can be perceived as hard even if it’s done effectively.

Summary
The essential click-testing metrics, like many other usability metrics, can be classified as effectiveness (e.g., location, success), efficiency (e.g., completion time, number of clicks), or perception/satisfaction (e.g., SEQ) metrics. These metrics provide quantitative support for more visually interpreted representations such as click maps and heat maps.