How long does it take users to complete a task? We really don’t know. Instead we have to take our best guess from a sample of users. But if you had to pick a single number to summarize how long it would take typical users to complete a task from a usability test what would you report? The mean? The median? The mode? Something else?
When we want one number to represent the most common or typical value we often use the average, or more specifically, the arithmetic mean. Any single estimate from a sample (especially a small sample) will almost surely be wrong, so it is important to include confidence intervals around your best guess. Because summary data often finds its way on dashboards and reports to managers, we need to come up with our best guess of the typical task completion time.
The mean works quite well to provide the center value or most “typical” value in a set of data that is roughly symmetrical. When the data become skewed by really large values, the mean is pulled upward. This happens when summarizing financial data like average home prices or average salaries. One really expensive home or the chief executive will pull the average way up. In these cases, the median is used to provide a more accurate picture of the middle or most typical value.
Task Time Data is Skewed (Not Normal)
Task time has a strong tendency to be positively skewed, with some users taking a long time to complete a task. This arises from the large individual difference in users. Some users encounter problems with an interface or just use computers slower as they complete tasks. A few long task times pull the mean task time up, making it no longer the typical task time. Instead it overstates the middle value. For example, the task times of 100, 101,102,103, and 104 have a mean and median of 102. Adding an additional task time of 200 skews the distribution, making the mean 118.33 and the median 102.5.
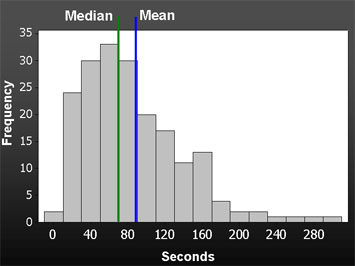
You can see the positive skew (tail points to the right) in the figure below. Figure 1 shows a histogram of the task times from 190 users who all completed a task on an intranet application. Notice how the mean is higher than the median.
 |
| Figure 1: A histogram of 190 completed tasks times showing the effect of a positive skew on the mean. The median of this task is 71 seconds and the mean is 85 seconds. The median is the point where half the users take more and half take less time. |
Why not report the median?
So why not just report the median task time like is done with home prices and salaries? The major difference is we’re using a sample to estimate the unknown population middle value. If we have a large sample, our median will estimate this unknown value quite well. If our sample is small (less than 25 users) then the sample median tends to be a bad estimate of the population median. The smaller the sample, the poorer the estimate.
The sample median is a poor estimator of the population median
The strength of the median in resisting the influence of extreme values leads to two problems—error and bias. The median doesn’t use all the information available in a sample. For odd numbered samples, the median is the central value; for even numbered samples, it’s the average of the two central values. Consequently medians are more variable than their respective means and exhibit more error in estimating. Another problem with medians is they tend to overestimate the actual middle value by as much as 10%. That can be a big deal when every second counts.
What estimates the median best at small sample sizes?
It turns out that there are literally hundreds of ways of generating averages. In a recent CHI paper [pdf], Jim Lewis and I examined some of the more promising methods for dealing with the positively skewed task times including the geometric mean, harmonic mean and excluding the largest times prior to computing the mean.
One average we didn’t test was the mode (the most frequent value). The mode doesn’t make a good average for task times since task time data can take on so many distinct values. The mode is often undefined (all unique values), or there are multiple modes (two duplicate values) or worse the mode comes from two task times far from the center.
To test the best average, we ran a Monte Carlo simulation on 61 large sample usability tasks and found that on average the geometric mean estimated the middle value of the population best and had the least bias (was just as likely to over and under estimate the median). For samples sizes less than 25 the geometric mean is the winner.
Simulation: Estimate the Median Using a Small Sample
To give you an idea of how this sort of thing works I created a simulation below.
- Click the button to draw a small sample from the large sample task shown in Figure 1. The median (middle value) of this task is 71 seconds.
- With each click a new the sample median and geometric mean are computed and the amount of bias and error is calculated over time.
- For example, a random sample of five times (36,60,81,92,105) generated a median of 81 seconds and a geometric mean of 70.1 seconds. The median was off by 10 seconds (14%) and the geometric mean was off by .9 seconds (1.3%).
- When done several thousand times across 61 tasks from our database and all sample sizes between 2 and 25 the geometric mean has 13% less error and 23% less bias than the sample median.


