 Individual differences in behavior and attitude often overshadow the differences in designs.
There are many ways to characterize how people differ. But one characteristic that drives both attitudinal and behavioral UX metrics is prior experience.
Beyond the more superficial aspects of demographic variables such as age, gender, income, and geography, a person’s experience with an interface tends to be a significant predictor of UX metrics. That is, more experience tends to be associated with more favorable UX metric scores (SUS, completion rates, times, etc.), and less experience tends to be associated with less favorable UX metric scores.
This applies to both productivity B2B-focused products such as QuickBooks and AutoCAD and more consumer-focused products such as TikTok, Facebook, or Spotify. But how do you measure someone’s experience with a product or an interface? We use three common approaches: tenure, frequency, and depth.
1. Tenure
How long have people been using the product?
A good way to start measuring experience is by understanding how long—if at all—someone has been using a product. If someone’s never used a product or seen an interface, then other experience questions don’t matter.
The longer people have been exposed to a product, the more likely they have used and encountered functionality in a product.
In an analysis we conducted over ten years ago, we found an average 11% difference in SUS scores between newer users (< 3 years of experience) and more experienced users (5+ years). We saw a similar difference in SUS scores for first-time versus repeat users of websites.
Depending on the type of product, there can be different levels of product experience that may be measured in days, months, or years. Generally, you should include a “Never” category along with longer tenure periods (as shown in Figure 1). You can always collapse consecutive low-tenure (“Never” and “Less than six months”) and high-tenure (“3-5 years” and “5+ years”) experiences into a smaller number of groups (as we did in our analysis).
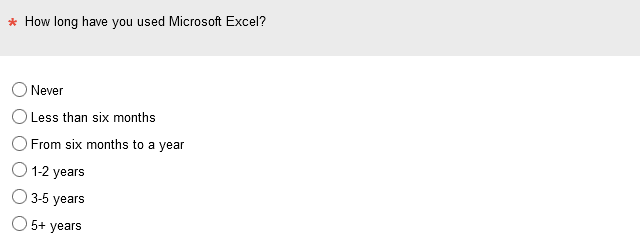
Figure 1: Example of a tenure item (created with MUIQ®).
2. Frequency
How frequently do people use the product?
Some products have users come back year after year, even if the product is used infrequently (for example, tax software, a GoPro camera, an auto insurance website). Other products have many users who have only recently started using them but have used them frequently since (for example, a new social media account, new software at work).
Frequency scales can vary based on the expected frequency and the research question. Similar to tenure, you want to be able to identify low-frequency versus high-frequency users. For an example, see Figure 2.
Although frequency and tenure can be correlated, they aren’t always highly correlated. They measure different enough aspects of product experience that one is not a replacement for the other.
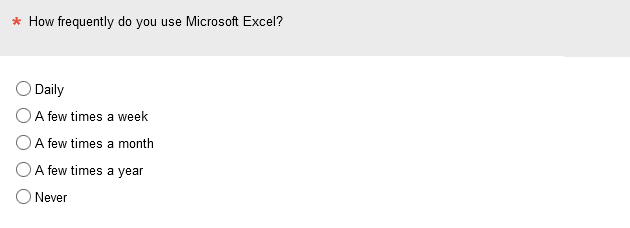
Figure 2: Example of a frequency item (created with MUIQ®).
3. Depth
How many features/functions of a product do people use?
Some products (for example, simple mobile games) have a very focused set of features. Other products (for example, QuickBooks, Salesforce, or Excel) have hundreds of features and functions, from reports to custom journal entries. You can use Excel just to document a set of data, or you can use functions of varying complexity to sort, filter, graph, and analyze the data.
A typical user may use only a small portion of a product even if they have used it daily for years. Almost all Word users create and edit documents, but relatively few use its merge mail features or generate macros.
You can assess by listing the product’s features, tasks, or functional areas that people use. When creating the list, include items that vary in their known frequency of use. For an example, see Figure 3.

Figure 3: Example of a depth item (created with MUIQ®).
An Experience Equation
Product Experience = Tenure + Frequency + Depth
You can use any combination of these measures to assess experience for screening and characterizing participants in a survey, usability test, or in-context observational study.
You can also combine them to have a more holistic view of a participant’s product experience. For example, you could define the most experienced users as those who have the most tenure, most frequency, and most depth, and then compare their results to those with the fewest.
Using the Excel examples, you could define very experienced users as those who have used the product for more than two years (Figure 1, Tenure), use it at least a few times a week (Figure 2, Frequency), and report using at least 75% of the activities in the checklist (Figure 3, Depth). For an example using these three metrics to define high, moderate, and low levels of product experience, see Table 1.
| Product Experience Level | Tenure | Frequency | Depth |
|---|---|---|---|
| High | > 2 yr | At least a few times a week | > 75% of checklist |
| Moderate | 6mo – 2 yr | At least a few times a month | 50–75% of checklist |
| Low | < 6 mo | At least a few times a year | < 50% of checklist |
Table 1: Example of using three product experience metrics in combination to define product experience levels.
There are no hard and fast rules for using these metrics in combination. Our example shows three groups, but you could define just two, or you could define four or more. Keep in mind to avoid definitions that are so restrictive that you don’t have a large enough sample size for that group.
In a future article, we’ll cover the interaction and correlation of these measures and discuss optimal ways to ask these questions.
Summary
There are three ways to measure a user’s product experience: tenure, frequency, and depth.
Because product experience affects product behaviors and attitudes, it’s important to measure at least tenure or frequency in UX research. Measuring both tenure and frequency is better, and measuring all three (tenure, frequency, and depth) is best.
When you measure all three, you can use them in combination to globally define levels of product experience.