 A lot happens when you observe a user during a usability test.
There’s the interface, the utterances, the body language and the metrics.
This rich experience can result in a long list of usability issues.
Issues can range from cosmetic (a user finds the type in ALL CAPS a bit much) to catastrophic (data loss), suggestions (a new feature) or positives (finding defaults helpful).
These usability issues should be described and usually accompanied by a screen shot or short video clip to illustrate their impact. But don’t stop there. Usability issues should be converted into a user by problem matrix.
User by Problem Matrix
A user by problem matrix organizes all the issues found by users. Issues include problems, suggestions and positives but we still call it a problem matrix because most issues are usually problems.
An example of a user by problem matrix is shown below from an evaluation of the Enterprise Rental Car website.
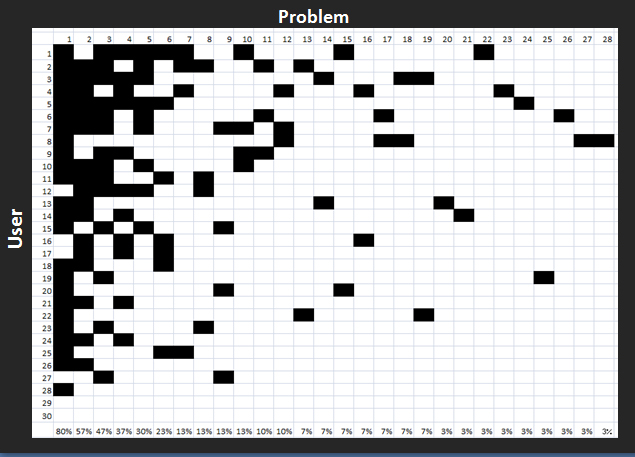
Figure 1: A User by Problem matrix for renting a car on Enterprise.com. This is not a QR code.
The users are numbered on the Y axis and the issues have each been given a number. Each black square represents which user encountered which problem. You can compute such matrices by task or across tasks for the whole usability test.
For this particular task, we observed 30 users encountering 28 unique issues while attempting to rent a car. We sort our problem matrices with the most frequent occurring problems on the left and users having the most problems on top. This gives the most problem density in the upper left corner.
A User by Problem matrix provides :
- Frequency by Problem: For example, the most common problem (far left) involved users having trouble adding a GPS navigation to their rental (they had to do it after they entered their personal details). This problem impacted 24 out of 30 users (80%). We can be 95% confident between 62% and 91% of ALL users would also have this problem.
- Frequency by User: The first user in the matrix encountered 9 of the 28 problems (32%) while user 28 encountered only 1 problem (3%) and users 29 and 30 encountered no problems while renting the car.
- Problems that affected only one user (the long tail of usability problems): The last nine problems were encountered by only a single user (3%).
- The average problem frequency: By averaging together the problem frequencies we get a sense of how common problems are. For this task, the average adjusted problem frequency is 12%, meaning users have about a 12% chance of encountering a usability problem given this task scenario. Technical Note: See the discussion on why and how to adjust Average Problem Frequencies.
- The percent of problems likely discovered: Given the total number of problems and the total number of problems encountered only once after observing 30 users we’ve seen about 97% of problems for this task, interface and type of user. See Chapter 7 of Quantifying the User Experience and the calculator for how to compute this figure as well as discussion on the limitations of this approach.
Problem matrices illustrate the point that some problems affect a lot of users and are quickly revealed with just the first 2-3 users. Other problems, which can have just as large an impact, are often less common and don’t show up until you’ve tested more users.
You can also compare problem matrices. The following image shows four matrices for two tasks on two different rental car websites: Enterprise and Budget.
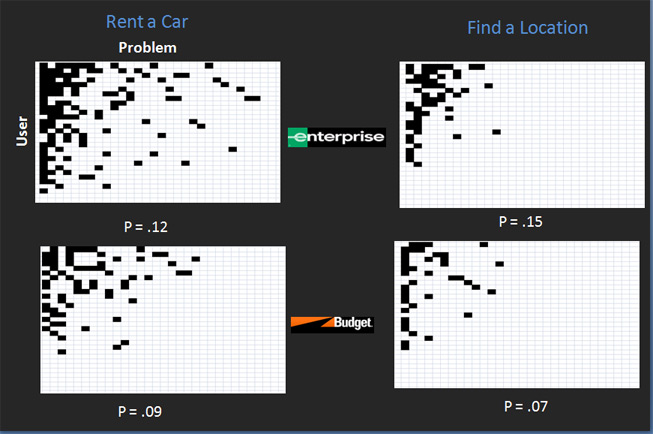
Figure 2: User by Problem matrices and average problem occurrences (P) for two tasks and two rental car websites.
For renting a car, Enterprise had an adjusted average problem frequency of 12% compared to Budget’s 9% for the same task. For finding the nearest rental location for a specified address the average problem frequency was 15% for Enterprise and 7% for Budget.
For both tasks, Enterprise had a higher frequency of usability problems and this was reflected in the lower task completion rates, longer task times and lower satisfaction scores we recorded in the comparative usability evaluation.
Taking that additional step of converting long lists of usability problems into a more numeric and visually digestible format provides both more clarity and credibility to usability testing.

")
")