 The worst of the pandemic may be over, but many changes remain, including our heavy use of meeting software.
The last time we investigated the user experience of meeting software was at the beginning of the COVID pandemic, with our article published in April 2020.
At that time, the usage of online meeting software had been growing steadily, so we compared UX metrics for Google Hangouts, GoToMeeting, WebEx, and Zoom using data collected just before the pandemic started (December 2019) with data collected in early April 2020.
In late 2019, just before the pandemic started, the leader of this group of products was GoToMeeting, with a Net Promoter Score (NPS) of 19% (Zoom’s was 6%). In the survey we ran just a few months later, Zoom had essentially the same NPS (4%), but GoToMeeting had dropped to −14%.
Zoom was poised to become the market leader, but a serious customer relationship problem emerged. There were questions about the security of its meetings and online recordings, and Zoombombing, where uninvited guests join meetings to engage in audiovisual vandalism, was becoming uncomfortably common. When we asked respondents what they most disliked about Zoom, 30% of the comments indicated a trust issue related to security. When we split Zoom respondents between those who expressed a trust issue and those who didn’t, there was no difference in ratings of perceived usability, but there was a statistically significant difference in the likelihood to recommend.
Soon after our study, Zoom announced several changes to address its security issues. But was it too late? Had Zoom missed its opportunity?
Apparently not. From 2019 through 2021, Zoom reported that its quarterly revenue increased by almost 600%.
Now, almost 2.5 years later, online video meetings will clearly remain a fact of life for most enterprises. In this article, we present some of the key findings from a 2022 replication of our study of the UX of meeting software. For more details, see the full report.
Meeting Software Benchmark Study
From April to July 2022, we conducted a retrospective study with 227 U.S.-based panel participants. This study included metrics from our standard UX and NPS survey.
A bit over half (57%) were male and tended to be younger, with 75% under 35. Participants were asked to reflect on their most recent experiences with the software and answer a number of items, including the NPS, SUS, UX-Lite™, and PMF. The products and sample sizes were:
- Google Hangouts: 51
- GoToMeeting: 53
- WebEx: 53
- Zoom: 70
UX Results
Loyalty (NPS and PMF)
The NPS is a popular loyalty metric. It’s calculated using an eleven-point (0 to 10) likelihood-to-recommend (LTR) question, computed by subtracting the percentage of detractors (0–6) from promoters (9–10).
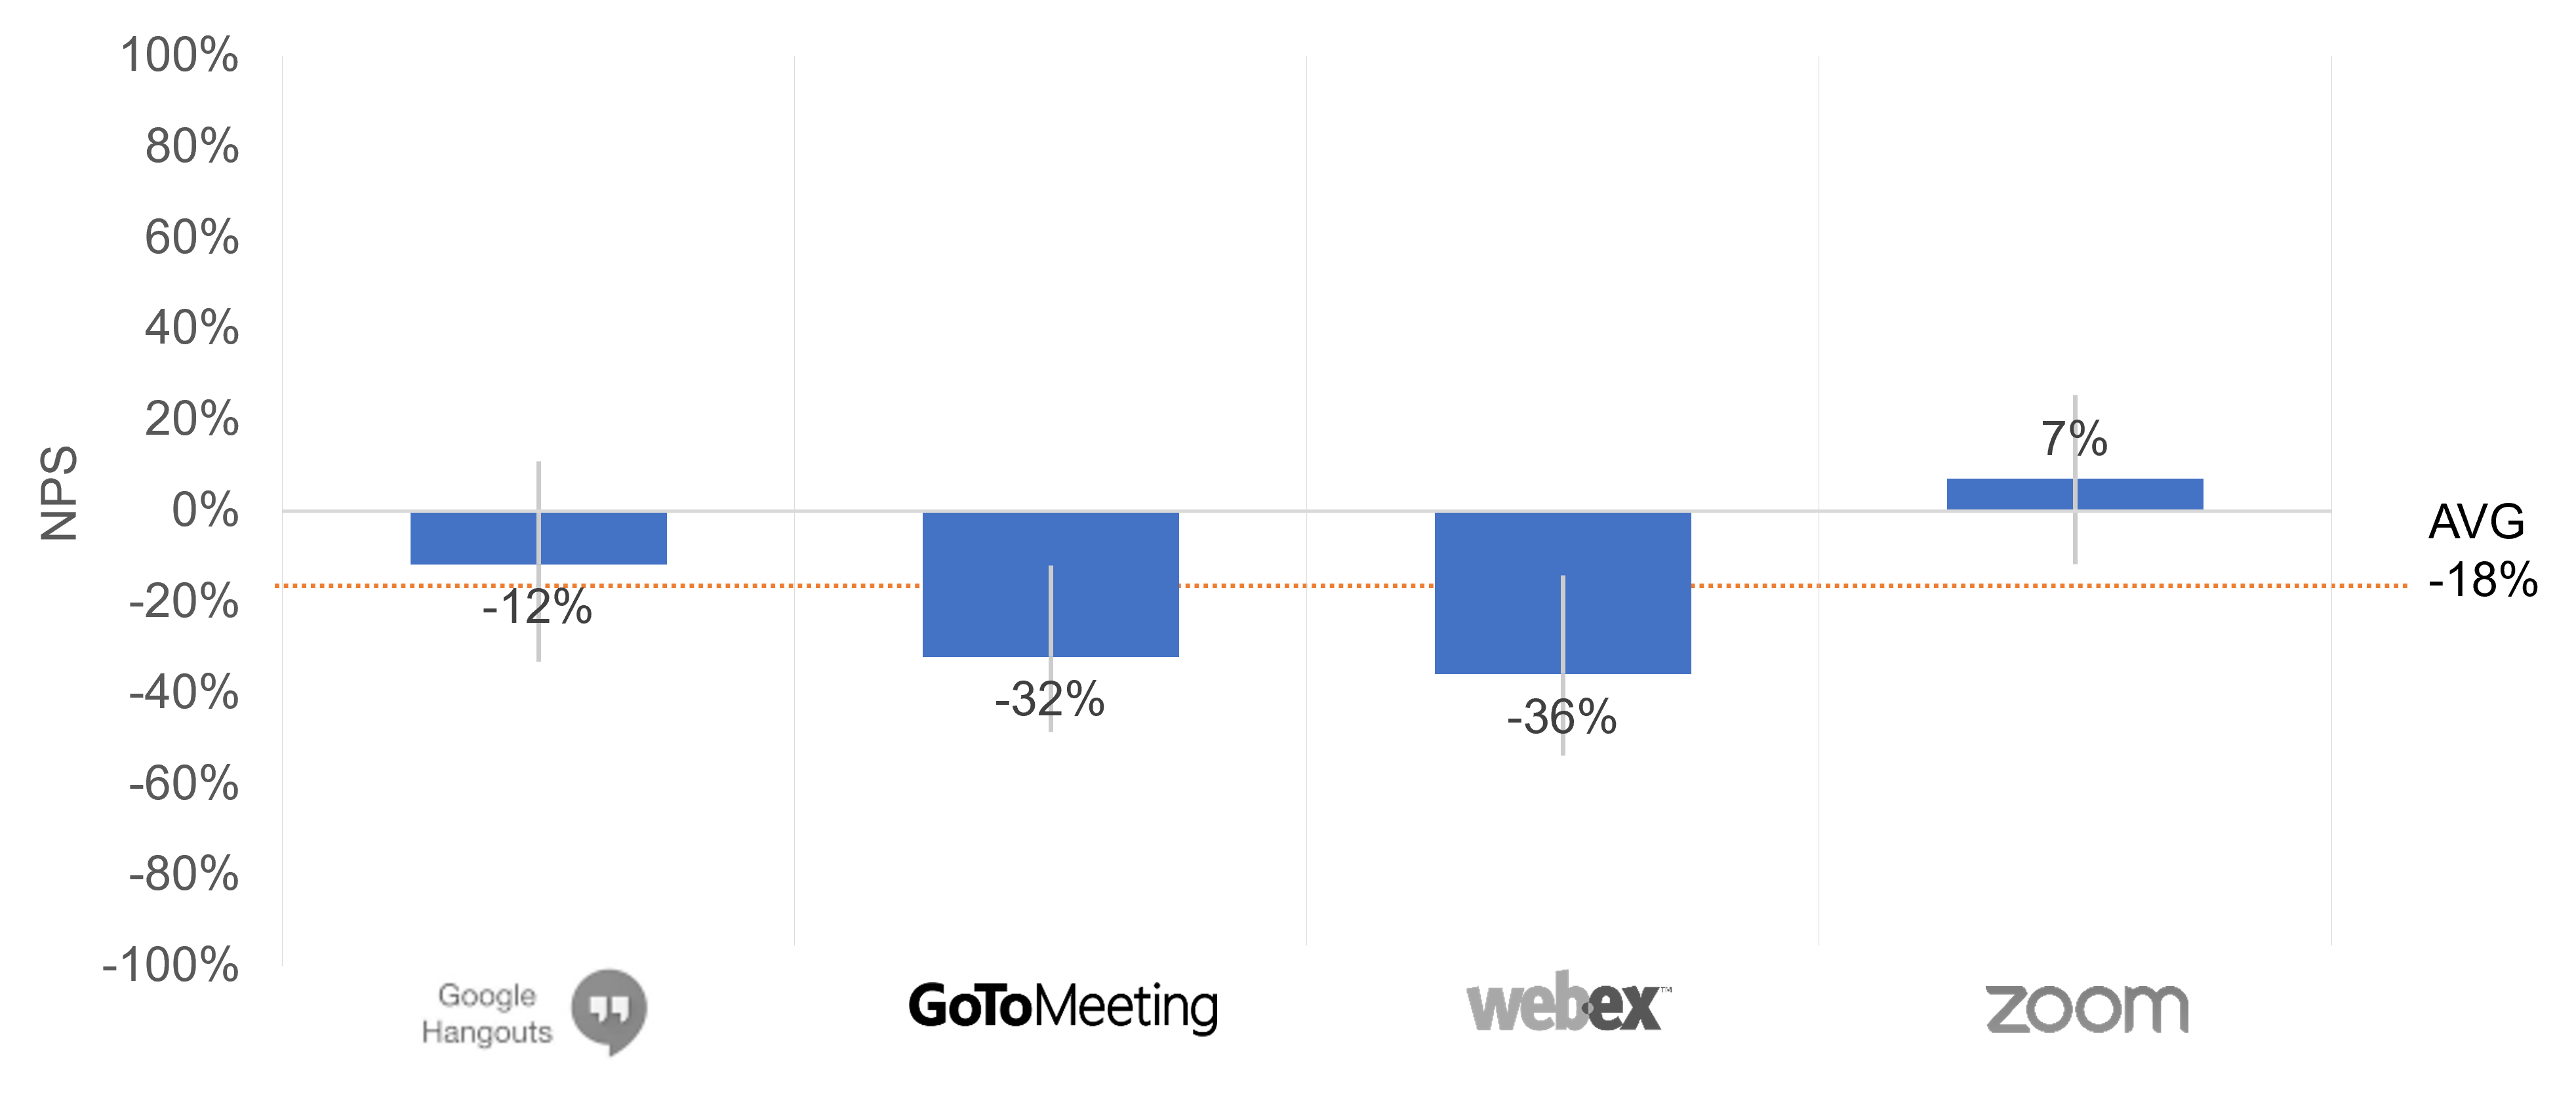
Figure 1 shows the current NPS for the four meeting software products.

The NPS for Zoom was essentially unchanged from our historical measurements, but the NPS for the other services dropped to historic lows. Only Zoom had a positive NPS (more promoters than detractors), with the lower bound of its confidence interval above the group average of −18%.
Zoom also had the highest mean Product-Market Fit (PMF), a measure of the extent to which users would be disappointed if they could no longer use a product.
Perceived Usability (SUS)
We used the popular System Usability Scale (SUS) to compute the perceived usability of the four products. SUS is a ten-item questionnaire with possible scores ranging from 0 to 100. The average SUS score from over 500 products (including websites and business software) is 68 (a grade of C on the Sauro-Lewis curved grading scale).
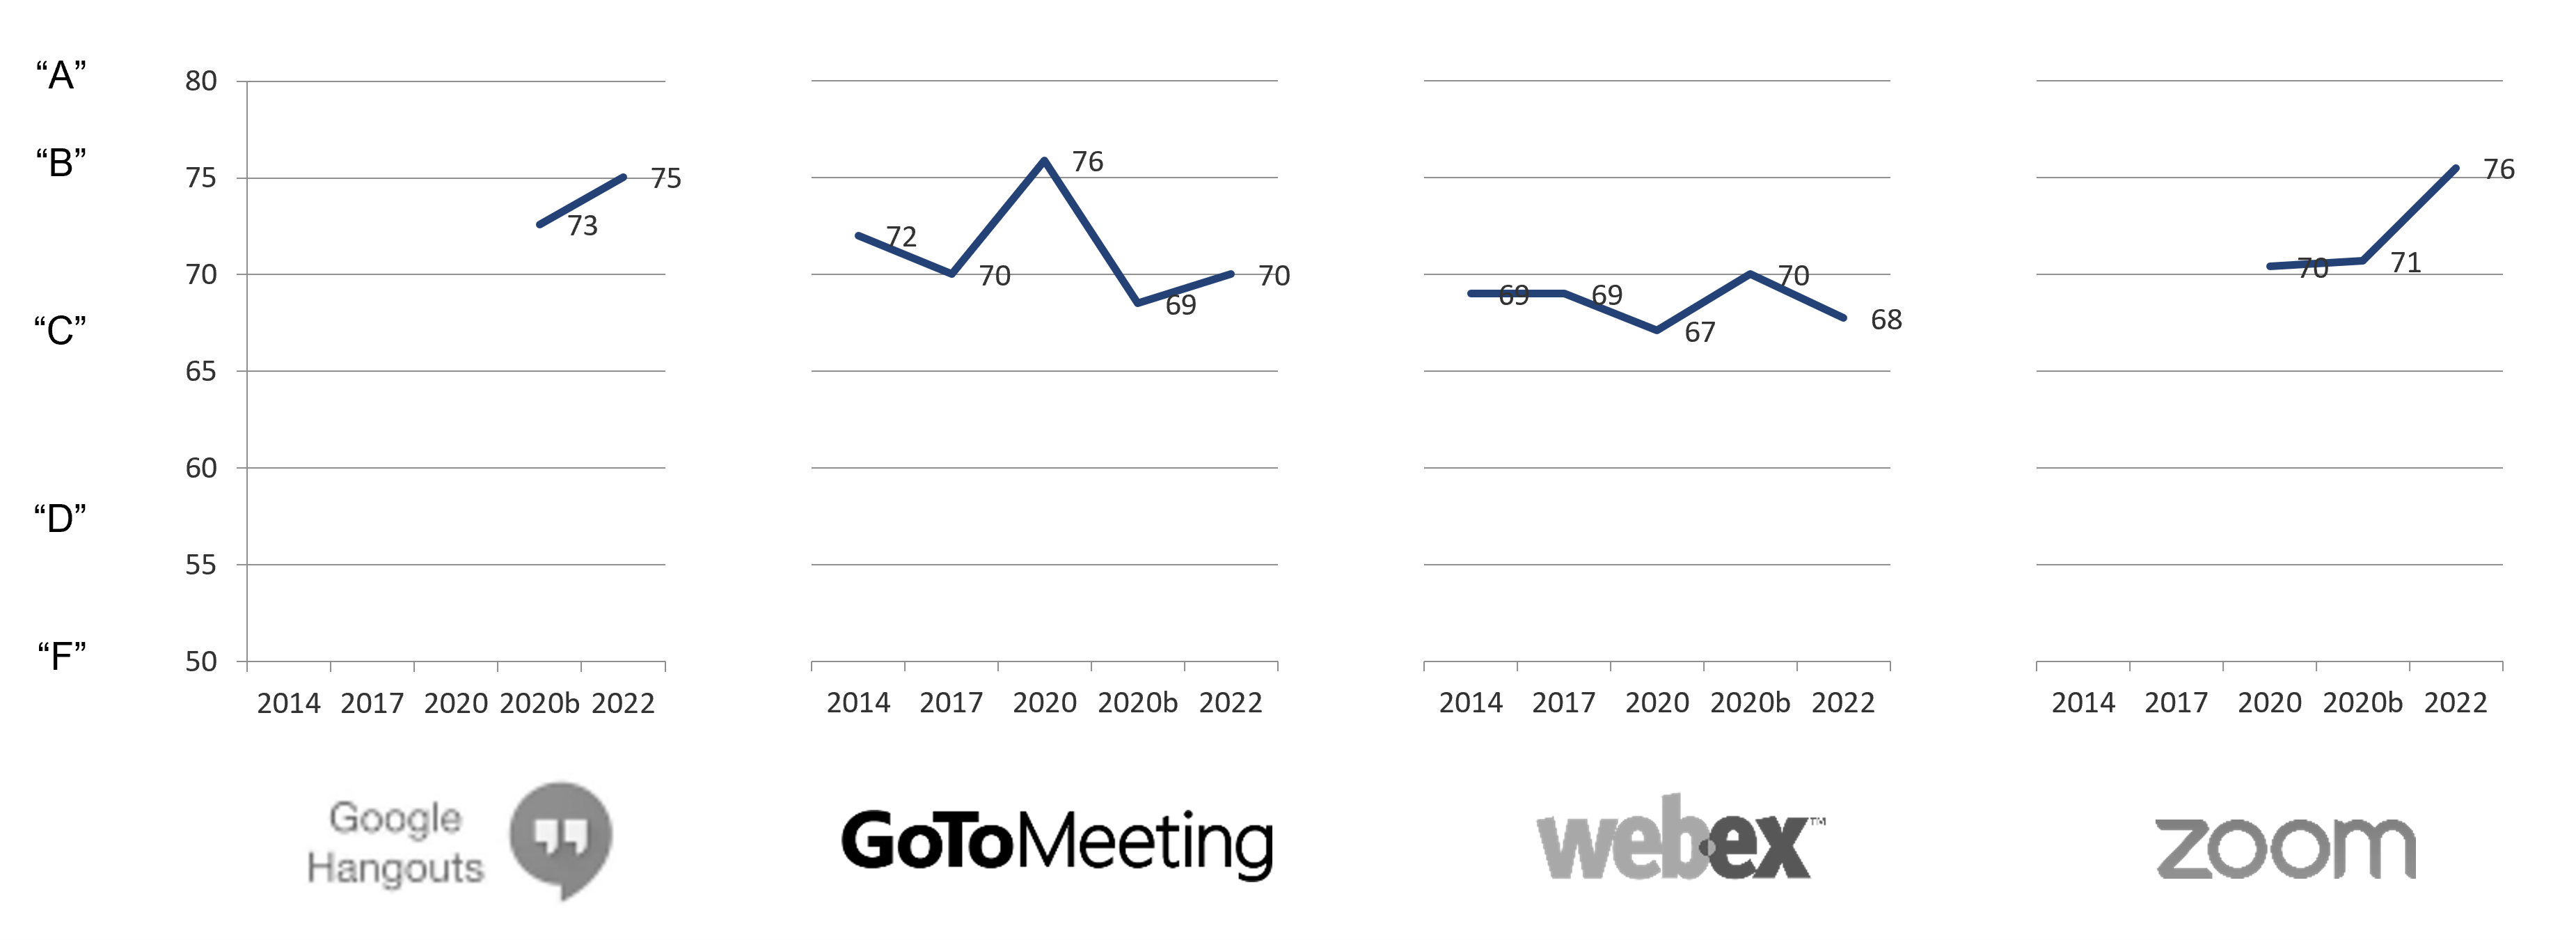
Figure 2 shows the current and historical mean SUS scores for the meeting software products.

In our current results, Zoom is the leader in perceived usability, just one point over Google Hangouts but with a five-point increase relative to its previous measurement. Using the Sauro-Lewis curved grading scale for the SUS, Zoom and Google Hangouts have a grade of B, while GoToMeeting and WebEx have grades of C.
Perceived Usefulness and Ease (UX-Lite)
Research on the Technology Acceptance Model (TAM) in the mid-to-late-1980s revealed the joint importance of measuring both ease of use and usefulness as key drivers of the intention to use a product, which is in turn a significant driver of actual use.
We use the two-item UX-Lite as a mini-TAM because it has one item to rate perceived ease of use (“This product is easy to use”) and one to rate usefulness (“This product’s features meet my needs”). UX researchers can use it in aggregate as a measure of acceptance or, even more broadly, satisfaction or quality of the product.
As shown in Figure 3, it’s also possible to analyze its ease and usefulness components separately, graphed in a scatterplot. The dotted red lines indicate the overall means for these four products.

The aggregate UX-Lite for Zoom was 80.7, significantly higher than the other products (Google Hangouts: 73.5, GoToMeeting: 71.0, WebEx: 69.8). The scatterplot shows that this is largely due to Zoom’s usefulness and ease ratings both being better than its competitors. Only Zoom is in the upper right quadrant of the scatterplot (above the group average for both measures). Google Hangouts, the only consumer product in this group, received an above-average rating for ease but was below average for usefulness. These findings are consistent with Zoom’s superior NPS in this group of products because other research has established a link between the components of the UX-Lite and likelihood-to-recommend (the behavioral intention metric from which the NPS is derived).
Analysis of Verbatim Comments
To dig into the “why” behind the current numbers, we asked participants to name one thing they disliked about the product they rated. Table 1 shows the top four issues for each product (with sample participant quotes).
| Product | Top Four Issues (% respondents) | Sample User Quote |
|---|---|---|
| Google Hangouts | Just basic functionality (9%) | I wish there were more features. It seems a little too simplistic. |
| Connectivity issues (7%) | Issues with connecting webcam | |
| Time limit too short (6%) | Only has 60-minute meeting limit | |
| Hard to use (6%) | Harder to use than Zoom or other conferencing tools | |
| GoToMeeting | Poor and dated UI design (16%) | The interface is much more dated than other web conferencing software. |
| Many prefer Zoom (10%) | Most people only use Zoom. | |
| Steep learning curve (6%) | Inadequate markup tools and hard to use | |
| Seeing/hearing everyone (6%) | Has problems with certain camerasHas problems with certain cameras | |
| WebEx | Slow (15%) | It took forever to load. |
| Clunky design (15%) | It's a clunky design. | |
| Poor connections (12%) | Unreliable, poor meeting connections | |
| Old, outdated (9%) | Low tech, system appears antiquated | |
| Zoom | Time limits on free version meetings (9%) | Meeting time limited for basic users |
| Clunky UI options (9%) | Some of Zoom's UI options are a bit clunky at times. For example, annotating or otherwise writing on the screen and/or screen sharing. While these options are useful to me, sometimes they are not the most intuitive to access and/or use. | |
| Privacy (7%) | The need to have an area dedicated to too many people seeing inside my house and hearing background noise in my house. | |
| Muting issues (7%) | I never know if I am joining a meeting muted or unmuted. |
Table 1: Top issues for four meeting software products.
Notably, none of the comments from the 70 Zoom users were indicative of security issues, which, along with its relatively high measures of loyalty, ease, and usefulness, strongly suggest that Zoom’s changes in early 2020 successfully addressed the trust issues the enterprise was facing at the start of the pandemic.
Summary
The results of our meeting software benchmarks based on 227 participants revealed the following takeaways:
The NPS fell for each of these products except Zoom. Zoom had a stable NPS from 2019 to 2022, staying just over 0. The NPS for Google Hangouts, GoToMeeting, and WebEx came in at historic lows (ranging from −12% to −36%).
Perceived usability ratings for the products ranged from average to above average. Using the Sauro-Lewis curved grading scale for the SUS, Zoom and Google Hangouts had a grade of B, while GoToMeeting and WebEx had grades of C.
Zoom had the best UX-Lite ratings. Zoom’s UX-Lite usefulness and ease ratings were both better than its competitors. Google Hangouts, the only consumer product in this group, received an above-average rating for ease (consistent with its SUS score) but was below average for usefulness, which likely accounts for its relatively low NPS. GoToMeeting and WebEx had relatively low scores for both ease and usefulness, consistent with their very low NPS.
Reported issues included dated UIs, time limits, and connectivity. There were some consistent themes from the analysis of verbatim comments. Analysis of the top four issues for these products found complaints about dated UI design for GoToMeeting and WebEx, time limits in free versions of Google Hangouts and Zoom, connectivity issues with Google Hangouts and WebEx, and clunky design for WebEx and Zoom.
Zoom had a security turnaround. The actions Zoom took at the beginning of the pandemic have reduced user concerns about its security in 2022. In our April 2020 survey, there was an unusually high frequency of comments indicating a lack of trust in Zoom, likely due to news reports about security issues. In the 2022 survey, none of the comments from Zoom users were about security issues. This, along with its relatively high measures of loyalty, ease, and usefulness, strongly suggest that Zoom’s changes in early 2020 successfully addressed the trust issues the enterprise was facing at the start of the pandemic.
For more details, see the full report.


